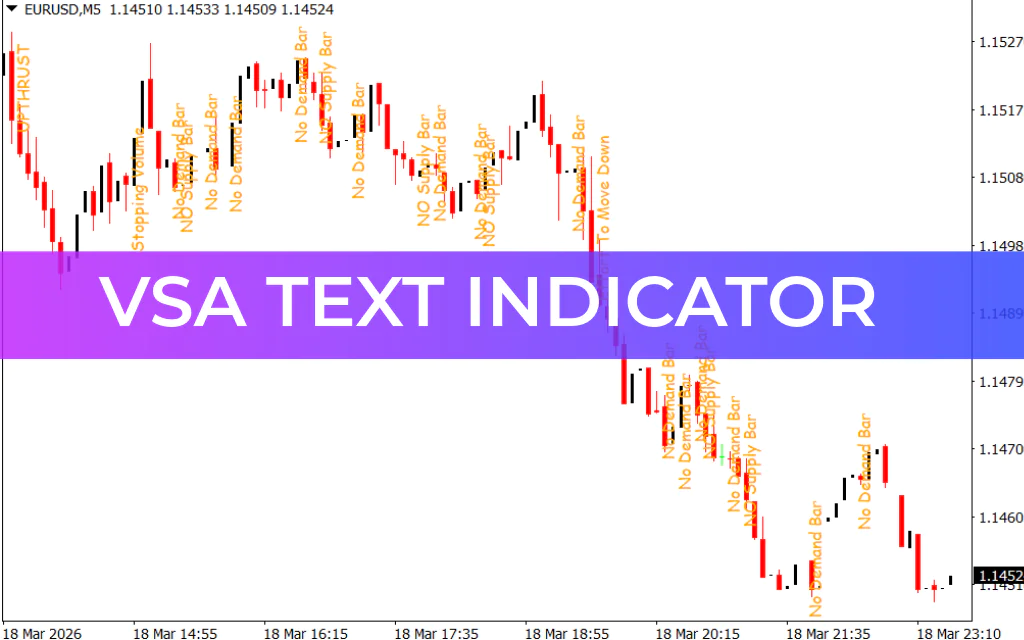
The VSA Text Indicator for MT4 is a powerful Volume Spread Analysis (VSA) tool designed to help traders understand the relationship between price movement and trading volume. By analyzing volume behavior, the indicator highlights potential market sentiment and possible trend reversals.
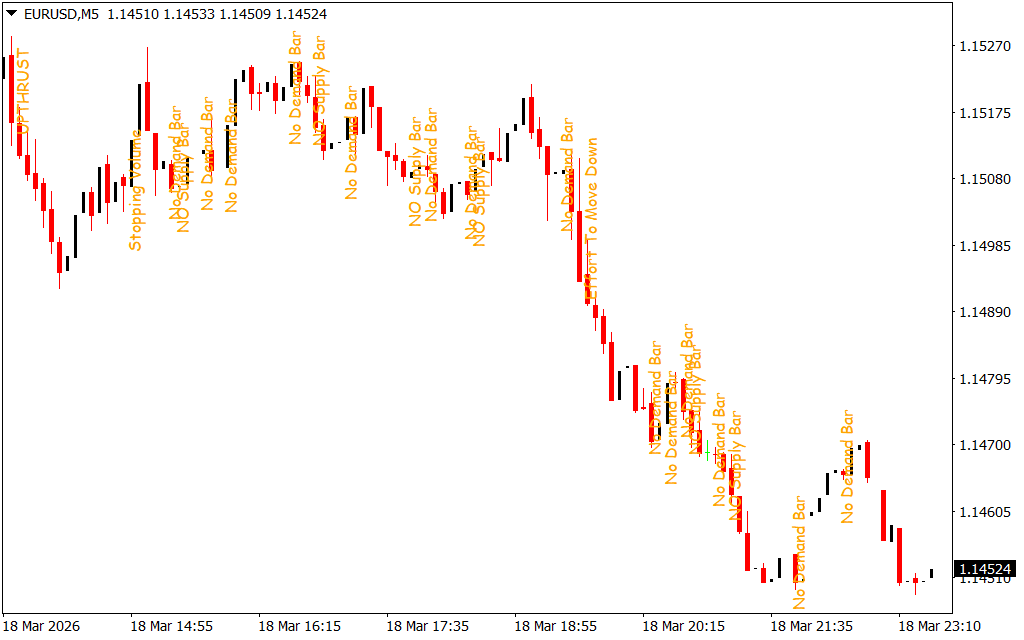
The indicator displays vertical text labels directly on the chart, identifying important volume-based patterns. These labels help traders quickly interpret whether buyers or sellers are gaining control of the market.
Because it focuses on volume and price spread, the VSA Text Indicator can provide valuable insights into Supply And Demand dynamics.
Key Signals of the VSA Text Indicator
The indicator displays several text signals that represent different market conditions. Each signal helps traders understand the current balance between buyers and sellers.
1. No Supply Bar
The No Supply Bar appears when there is very little buying activity in the market. This signal suggests weak demand from buyers and may indicate a potential downward movement.
2. No Demand Bar
The No Demand Bar indicates that sellers are reluctant to enter the market. This condition can signal a potential upward movement, as selling pressure is low.
3. Effort to Move Up
This signal appears when the market shows strong bullish pressure. It is represented by an upward-moving candlestick, indicating that buyers are attempting to push the price higher.
4. Effort to Move Down
The Effort to Move Down signal highlights strong bearish pressure and appears when the price forms a downward-moving candlestick.
5. Upthrust
The Upthrust Bar signals a potential bullish breakout or strong upward movement, suggesting buyers are trying to dominate the market.
6. Reverse Upthrust
The Reverse Upthrust indicates a possible Trend Reversal, often suggesting the market may shift direction after a strong move.
7. Stopping Volume
The Stopping Volume signal appears when market activity slows significantly. It suggests very low trading volume, which may occur before a reversal or consolidation phase.
How the VSA Text Indicator Works
The VSA Text Indicator analyzes the correlation between Price Action and volume levels. By studying this relationship, traders can identify potential market moves before they fully develop.
The indicator mainly focuses on supply and demand zones, helping traders determine where institutional activity might be influencing the market.
These text signals make it easier to interpret complex volume behavior directly from the trading chart.
How to Trade with the VSA Text Indicator
The VSA Text Indicator highlights potential market conditions using text signals. Traders can use these signals to determine possible trade opportunities based on supply and demand dynamics.
To improve accuracy, many traders combine the indicator with Support And Resistance levels, trend lines, or other volume indicators.
The indicator can also be used on any timeframe, making it suitable for Scalping, intraday trading, and swing trading strategies.
VSA Text Indicator Buy Setup
- Identify the No Supply Bar on the chart.
- Wait for confirmation that the trend is starting to move upward.
- Enter a buy trade near the No Supply signal.
- Place a stop-loss below the recent swing low.
- Exit the trade when either:
- A No Demand Bar appears, or
- An Effort to Move Down signal is generated.
VSA Text Indicator Sell Setup
- Identify the No Demand Bar on the chart.
- Wait for the downtrend to begin forming.
- Enter a sell trade near the No Demand signal.
- Place a stop-loss above the recent swing high.
- Exit the trade when either:
- A No Supply Bar appears, or
- An Effort to Move Up signal appears.
Conclusion
The VSA Text Indicator for MT4 is a valuable tool for traders who want to analyze market volume and price spread behavior. By displaying clear text signals on the chart, it helps traders identify potential supply and demand shifts.
However, like most volume-based indicators, it may generate false signals on lower timeframes. For best results, it should be combined with other technical analysis tools such as support and resistance or additional volume indicators.
FAQ
1 Download
Published:
Mar 18, 2026 18:34 PM
Category: