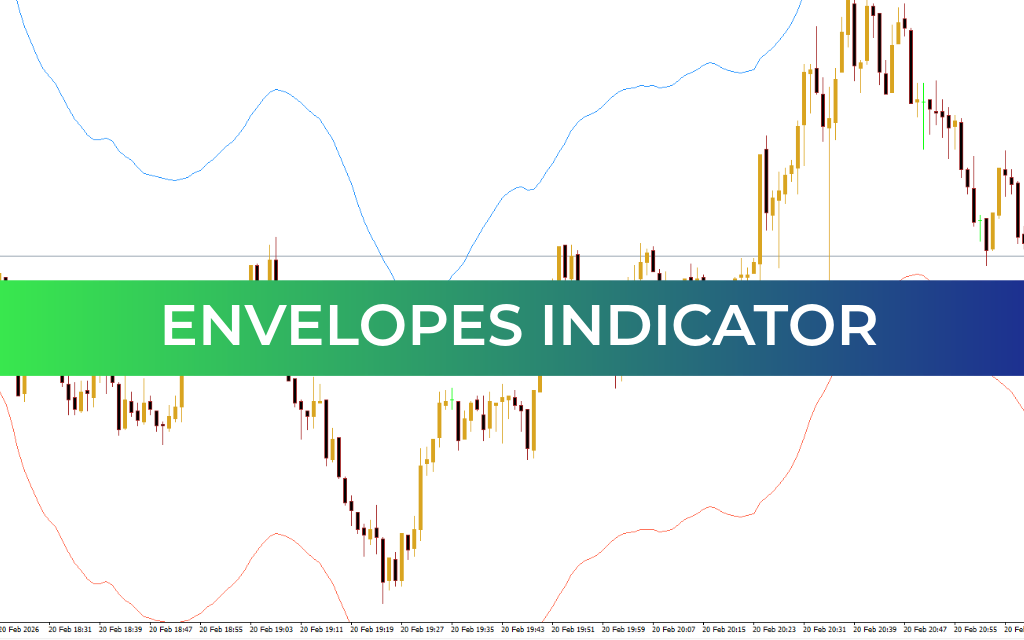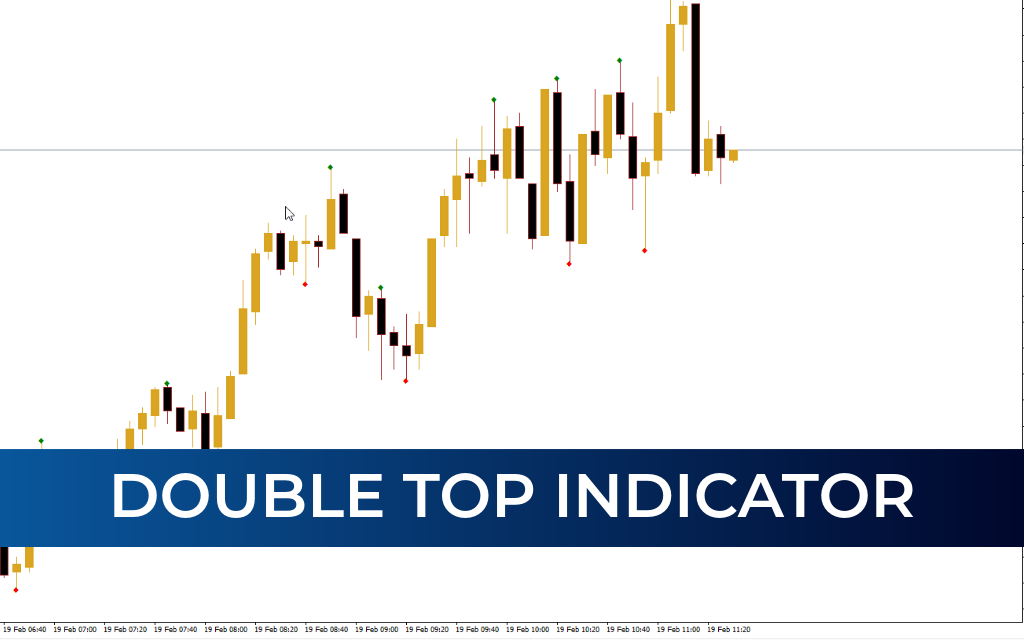
The Double Top Indicator is a technical analysis tool designed to identify potential market reversals by marking Price Action with visual signals. It plots green and red diamonds on the chart to help traders quickly recognize shifts in Market Structure and momentum.
During an uptrend, the indicator displays green diamonds above price bars, highlighting the formation of higher highs and higher lows — a sign of bullish market strength.
In contrast, when the market enters a downtrend, the indicator plots red diamonds, indicating lower highs and lower lows, which reflect bearish price movement.
The traditional double-top pattern forms when price reaches a resistance level, pulls back, and then attempts to break that resistance again but fails. This rejection is widely interpreted as a bearish reversal signal, suggesting weakening bullish momentum.
By visualizing these conditions through colored diamond markers, the indicator simplifies the process of spotting potential reversals and trend changes. While it can be applied to any timeframe, it generally provides more reliable insights on higher timeframes.
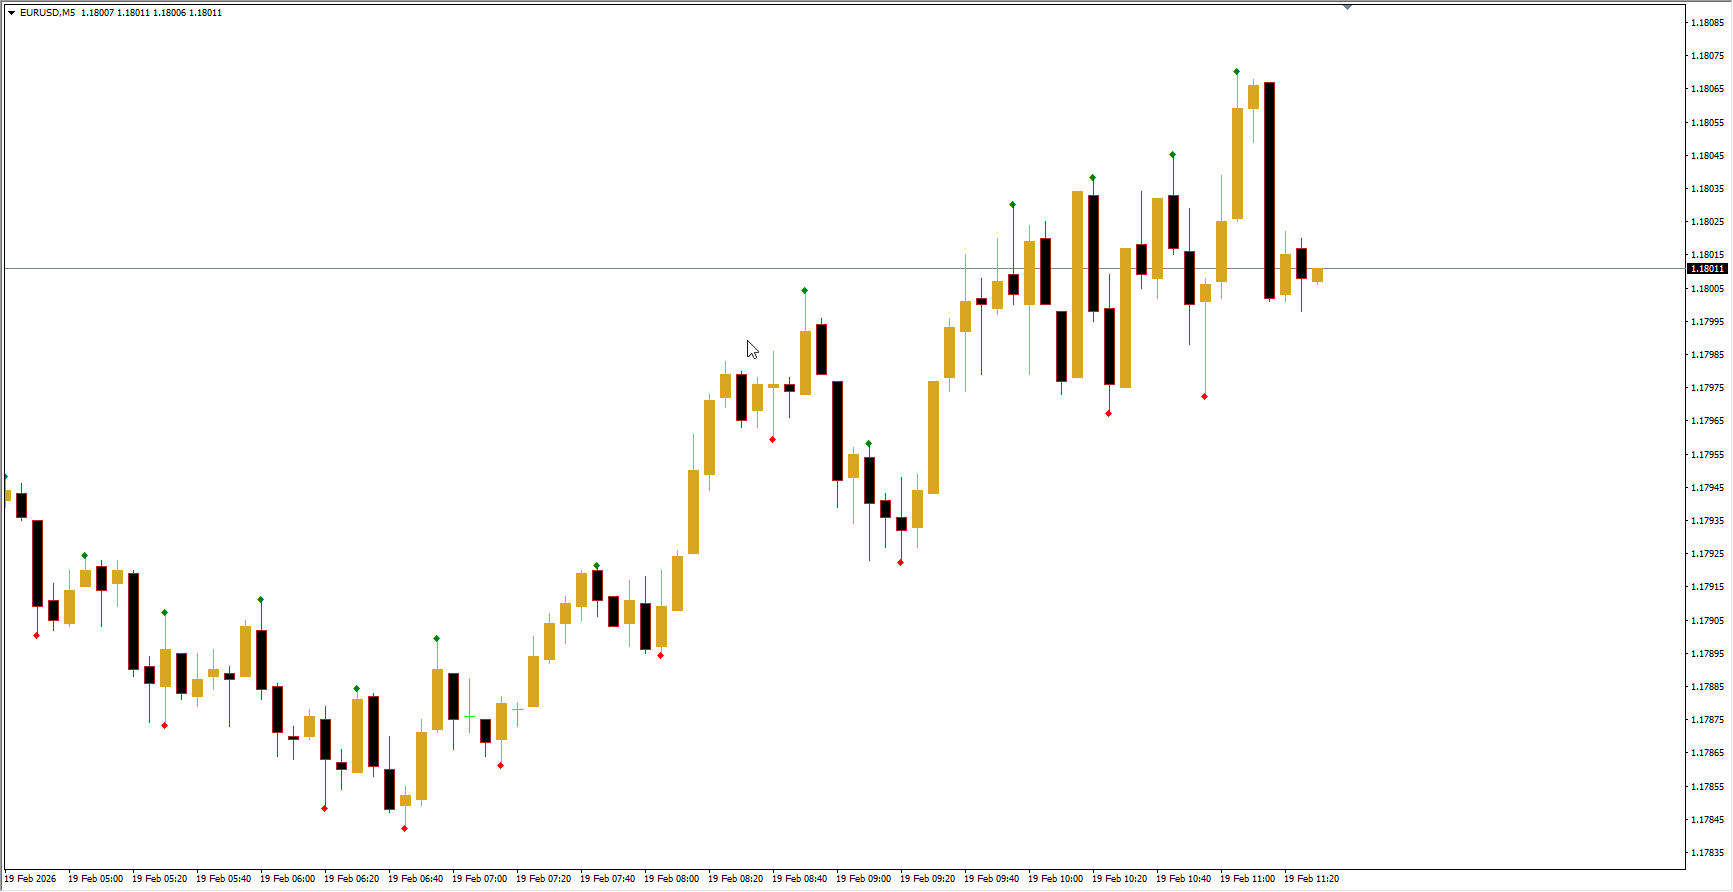
How to Use the Double Top Indicator in MT4
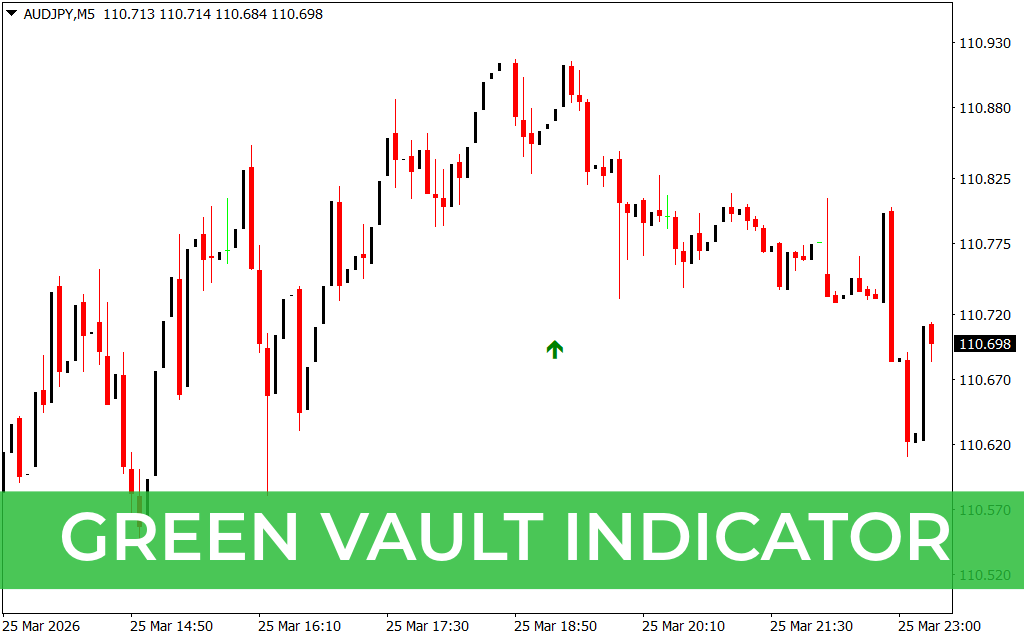
The indicator highlights potential reversal zones rather than direct BUY or SELL signals.
A green diamond suggests a possible shift from a bearish trend to a bullish trend.
A red diamond suggests a possible shift from a bullish trend to a bearish trend.
For more precise trade entries and exits, traders often combine this indicator with other technical tools such as:
RSI
Trendlines
Support And Resistance levels
Other momentum indicators
Conclusion
The Double Top Indicator for MT4 provides a clear visual representation of potential market reversals through red and green diamond markers. By interpreting these signals within broader market context, traders can better understand trend direction and identify possible turning points in price action.
FAQ
1 Download
Published:
Feb 19, 2026 04:33 AM
Category: