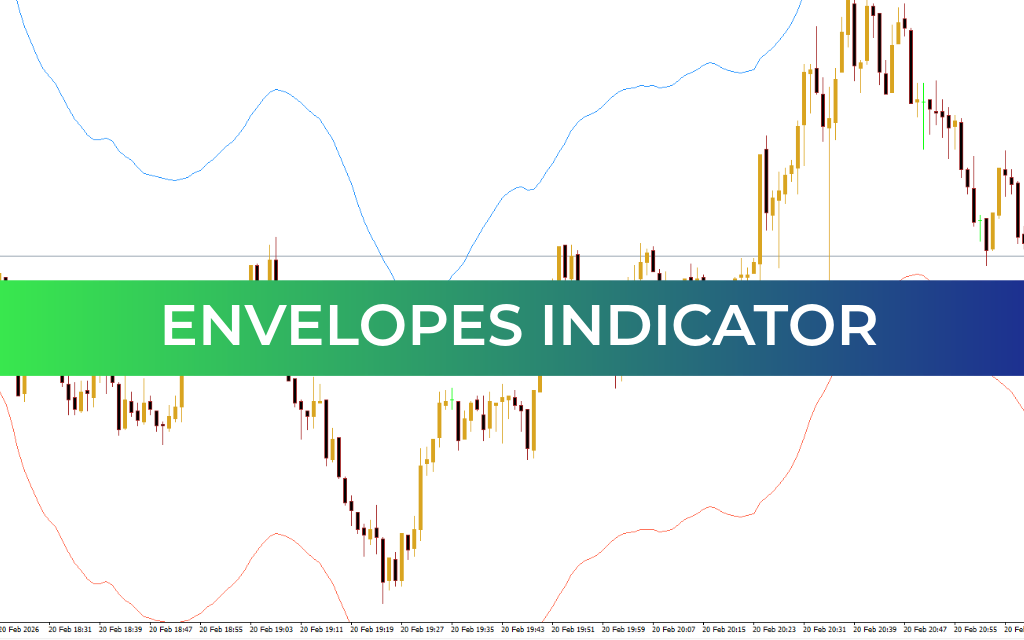
The Envelopes Forex Indicator is a standard technical tool available in the MT4 trading platform. It closely resembles Bollinger Bands in appearance, but differs in how it is calculated and applied. The indicator is based on the principle that price tends to return to its average value after strong movements caused by temporary buying or selling pressure. Most of the time, markets remain in equilibrium, and extreme price deviations are usually short-lived.
Like Bollinger Bands, the Envelopes indicator creates a price channel defined by an upper and a lower boundary. Price typically fluctuates within this range, and when it moves beyond the limits, it often returns back inside the band.
How the Envelopes Indicator Works
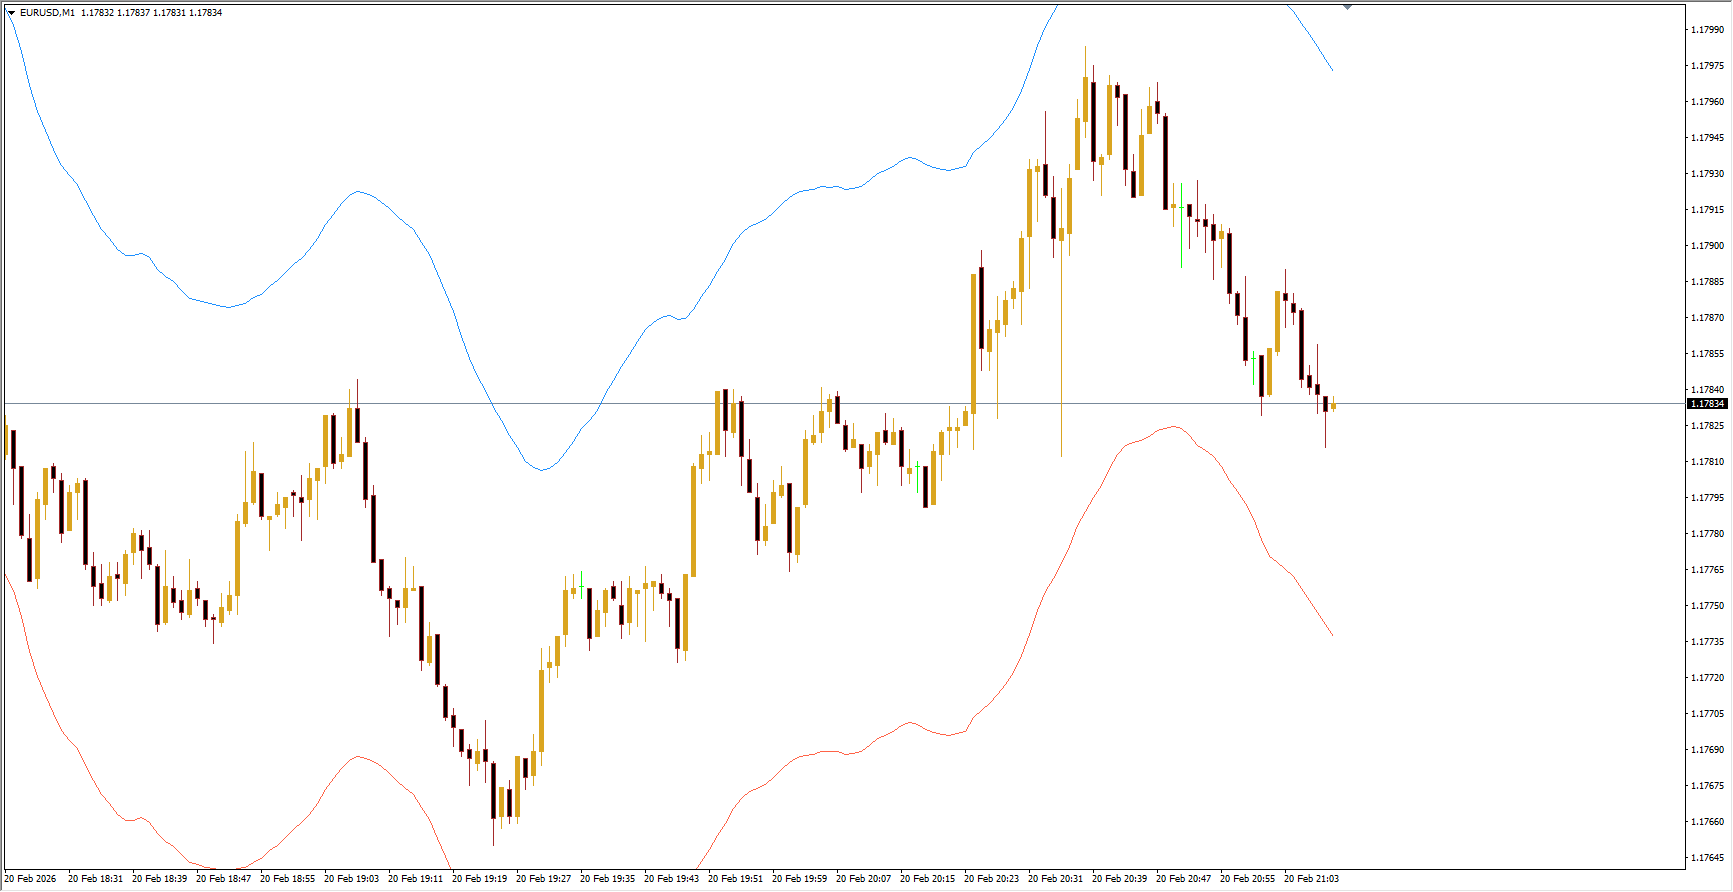
Technically, Envelopes consist of two moving averages that form a channel around price. These averages are offset from a central moving average by a fixed percentage. A common default setting uses a 14-period moving average with a deviation of about 0.1%, which keeps the upper and lower bands parallel and evenly spaced. Some traders also plot a middle line from which the offsets are calculated.
Visually, the indicator forms a “tape” that surrounds Price Action. During strong market movements, price may temporarily break outside the bands, but it often reverts to the normal range afterward.
How to Interpret the Envelopes Indicator
Reliable trading signals occur when price moves beyond the upper or lower band. However, these signals should ideally be confirmed by another indicator before entering a trade.
A common strategy is range trading within the channel:
Buy when price touches or approaches the lower band.
Sell when price approaches the upper band.
Close positions if price breaks outside the channel.
To reduce false signals, many traders wait for price to break a band and then re-enter the channel before opening a position. This confirms that the breakout was temporary.
When adjusting settings, keep the deviation between 0.1% and 2%. A wider deviation makes the channel too broad and reduces useful signals.
Additional Trading Guidelines
The indicator performs best on higher timeframes (30-minute charts or above).
Wait for at least one candle to close inside the channel before entering a trade.
Use confirmation tools such as RSI for stronger signals.
A common take-profit target is the middle of the channel.
Place stop-loss orders slightly beyond recent highs or lows.
Conclusion
The Envelopes indicator is a simple yet effective tool for identifying price extremes and trading within stable market ranges. Since it is based on moving averages and mean reversion, combining it with confirmation indicators like RSI can significantly improve trading accuracy.
FAQ
1 Download
Published:
Feb 20, 2026 14:43 PM
Category: