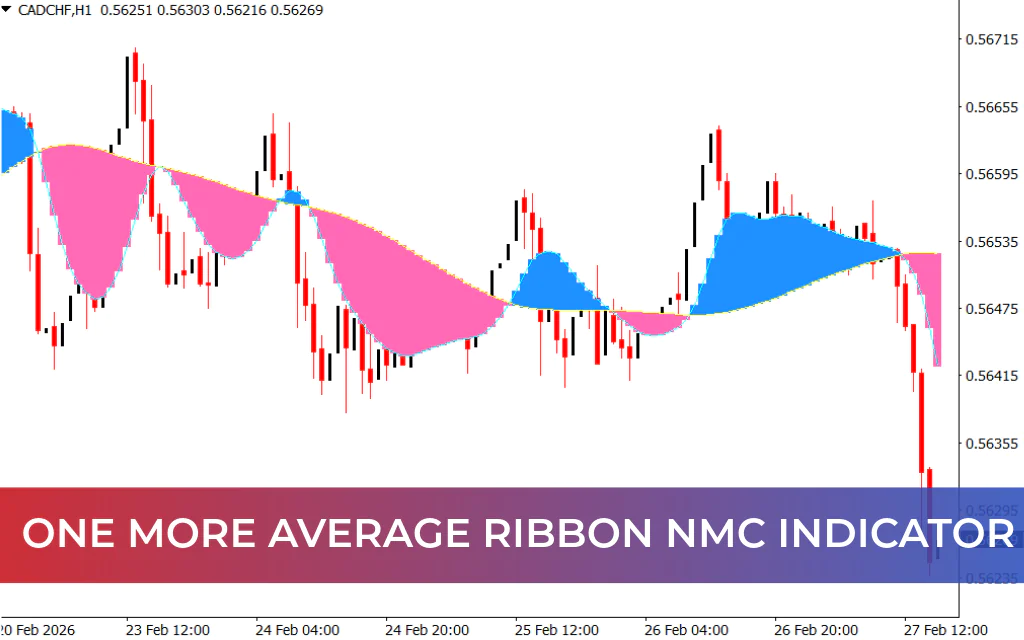
The XARDG RSIOMA Indicator for MT4 combines the classic RSI (Relative Strength Index) with the OMA (Oscillator of Moving Averages) to generate stable and reliable Forex trading signals.
- RSI measures Trend Strength and identifies overbought/oversold conditions.
- OMA helps determine trend direction and potential reversal zones.
By merging these two concepts, the indicator delivers clear entry and exit signals suitable for both beginner and advanced traders. It is non-repainting after candle close and works on all timeframes — from intraday charts to daily, weekly, and monthly charts.
How the XARDG RSIOMA Indicator Works
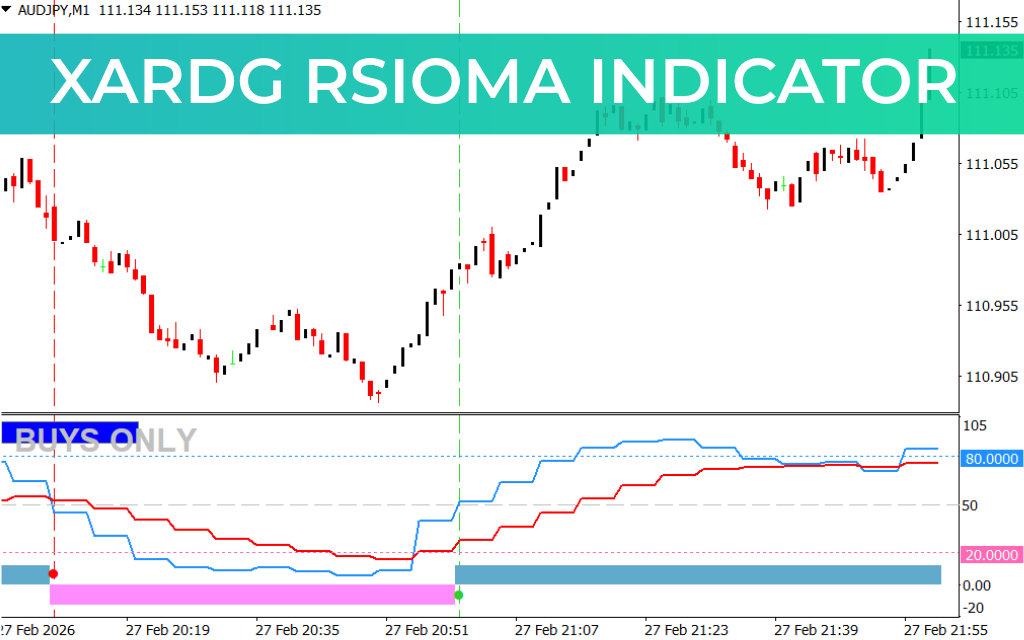
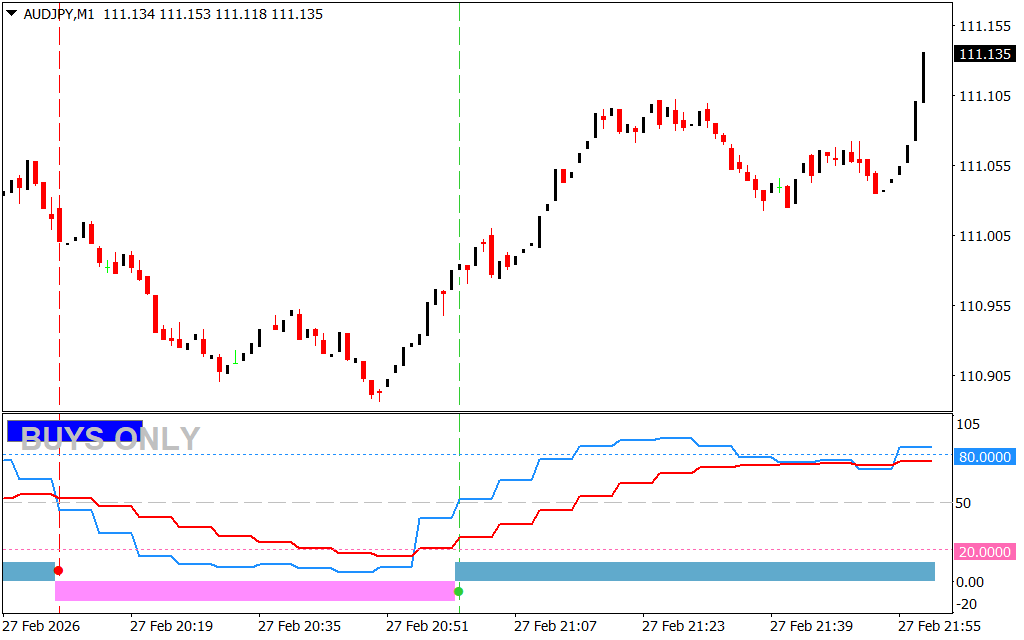
The indicator window displays:
- Red Line → RSI
- Blue Line → RSIOMA
- Levels → 0, 50, and 100
Additionally:
- Green signals on chart → Potential Buy signals
- Red signals on chart → Potential Sell signals
Trading Strategy 1 – RSI & RSIOMA Crossover
Buy Setup
- The Blue (RSIOMA) line crosses above the Red (RSI) line.
- This signals bullish momentum.
- Enter a Buy trade at candle close.
- Place stop loss below the previous swing low.
- Exit when an opposite crossover occurs.
Sell Setup
- The Blue line crosses below the Red line.
- This signals bearish momentum.
- Enter a Sell trade at candle close.
- Place stop loss above the previous swing high.
- Exit when the opposite crossover appears.
This is a trend-following strategy and works well in trending markets.
Trading Strategy 2 – 50-Level Confirmation (Stronger Signal)
For more reliable signals, wait for additional confirmation:
Buy Confirmation
- After bullish crossover, wait until both lines move above the 50 level.
- RSI above 50 confirms strong bullish momentum.
- Enter Buy trade with stop below swing low.
Sell Confirmation
- After bearish crossover, wait until both lines move below the 50 level.
- RSI below 50 confirms strong bearish momentum.
- Enter Sell trade with stop above swing high.
This method may delay entry slightly but provides more stable and higher-quality signals.
Key Features
- Combines RSI and Oscillator of Moving Averages
- Non-repainting after candle close
- Clear crossover-based trading signals
- 50-level confirmation improves accuracy
- Works on all MT4 timeframes
- Suitable for trend-following strategies
- Beginner-friendly yet powerful for advanced traders
Why Use the XARDG RSIOMA Indicator?
- Identifies trend strength and direction simultaneously
- Filters weak RSI signals using OMA smoothing
- Offers multiple trading strategies
- Works well for intraday and swing trading
- Provides structured entry and exit rules
Conclusion
The XARDG RSIOMA Indicator for MT4 is a powerful hybrid tool that enhances traditional RSI trading by integrating the Oscillator of Moving Averages. It delivers clear crossover signals, stronger confirmation with the 50-level filter, and non-repainting stability.
For traders already using RSI strategies, this indicator offers a more refined and structured approach to identifying profitable trading opportunities.
FAQ
5 Downloads
Published:
Feb 28, 2026 09:48 AM
Category: