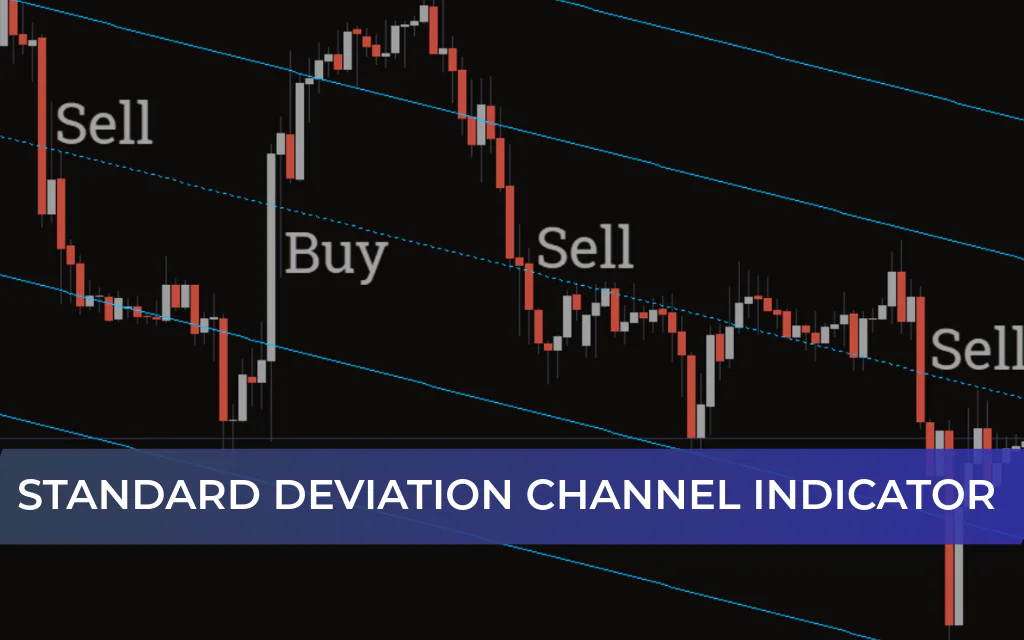
The Standard Deviation Channel Indicator for MT4 automatically plots price channels on your chart using statistical standard deviation. Unlike manually drawn channels, this indicator calculates levels mathematically, helping traders eliminate emotional bias and improve consistency.
The channel consists of:
Midline (dotted Deep Sky Blue) – The central trend line
Inner Channel Lines – Dynamic Support And Resistance
Outer Channel Lines – Extreme deviation levels
These lines act as support and resistance zones, helping traders identify bullish and bearish market conditions, entry points, stop loss levels, and profit targets.
For traders who enjoy channel-based strategies, similar tools such as the Auto Channel Indicator and Linear Regression Channel Indicator can also complement this approach with slightly different channel calculations.
Why Use the Standard Deviation Channel Indicator?
After installation (simply place the file in the MT4 Indicators folder and refresh the platform), the indicator immediately plots clean, objective channels on the chart.
What makes it powerful:
Channel placement is mathematically calculated
Reduces subjectivity compared to manual drawing
The midline helps identify early trend continuation or reversal
Works on all timeframes
It is suitable for both beginner and advanced forex traders.
Standard Deviation Channel Indicator Trading Signals
Trend Identification
Price above midline → Bullish market condition
Price below midline → Bearish market condition
The midline acts as a trend filter.
Conservative Trading Strategy
Buy Setup
Price bounces from the lower inner channel.
Price crosses above the midline.
Enter BUY position.
Stop Loss:
Below the lower channel line.
Take Profit:
Upper channel line.
Sell Setup
Price closes below the midline.
Enter SELL trade.
Stop Loss:
Above the upper channel line.
Take Profit:
Lower channel line.
Aggressive Reversal Strategy
For traders comfortable with higher risk:
Buy when price touches the outer lower channel.
Sell when price touches the outer upper channel.
Target the opposite extreme of the channel.
⚠ Always confirm with:
Price Action (engulfing, pin bars)
Trading volume
Key support and resistance zones
Multi-Timeframe Usage
The indicator performs well on:
Intraday charts (M15, M30, H1)
Swing trading charts (H4, D1)
Weekly and monthly charts
Higher timeframes (H1, H4, D1) generally provide cleaner signals with less market noise.
Pros and Cons
✅ Pros
Automatically generates precise statistical channels
Removes emotional bias
Clear support and resistance visualization
Works across all timeframes
Beginner-friendly
Effective for trend and reversal trading
❌ Cons
May produce false signals during high-volatility news events
Lower timeframes can generate noise
Best results require confirmation from other indicators
Frequently Asked Questions (FAQ)
Does the Standard Deviation Channel Indicator repaint?
No. Once drawn, the channel remains fixed. New bars extend the channel but do not alter past signals.
Which timeframe works best?
H1, H4, and D1 typically provide the most reliable signals.
Can it be used for scalping?
Yes, but lower timeframes are more sensitive to noise. Use volume or additional confirmation tools.
Is it suitable for beginners?
Yes. The automatic channel plotting makes it easier to understand support and resistance levels.
Should it be used alone?
It can work independently, but combining it with tools like RSI, MACD, or candlestick analysis improves accuracy.
Conclusion
The Standard Deviation Channel Indicator for MT4 is a powerful volatility-based tool that automatically creates statistical price channels. By removing manual guesswork, it provides objective support and resistance levels, helping traders identify high-probability entry and exit points.
Whether you trade breakouts, reversals, or trend continuation setups, this indicator adapts to multiple trading styles and timeframes.
It is free to download, easy to install, and highly effective when combined with proper risk management and price action analysis.
FAQ
2 Downloads
Published:
Feb 20, 2026 07:26 AM
Category: