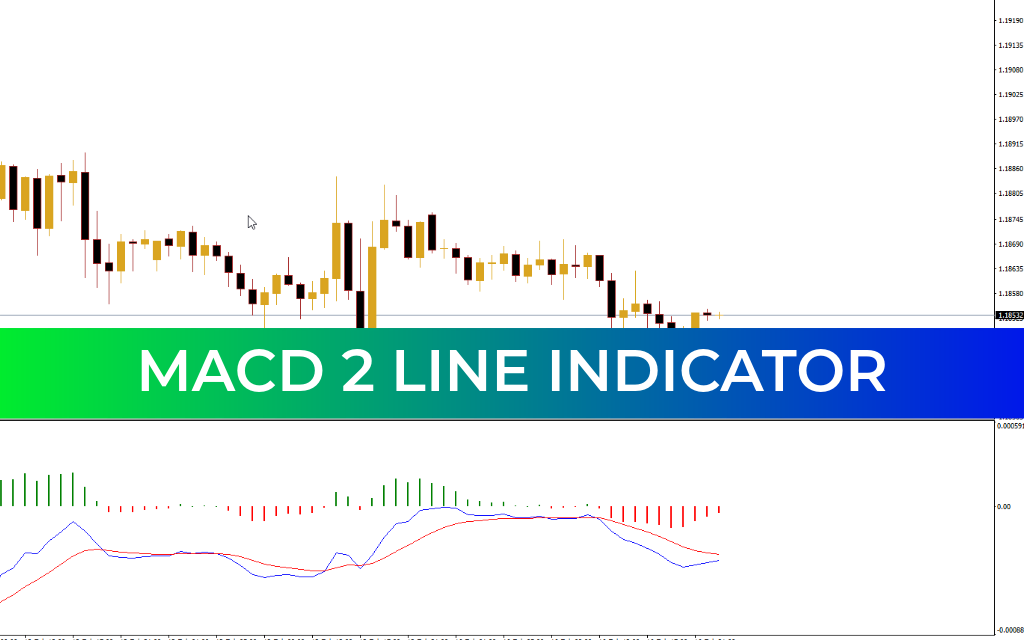
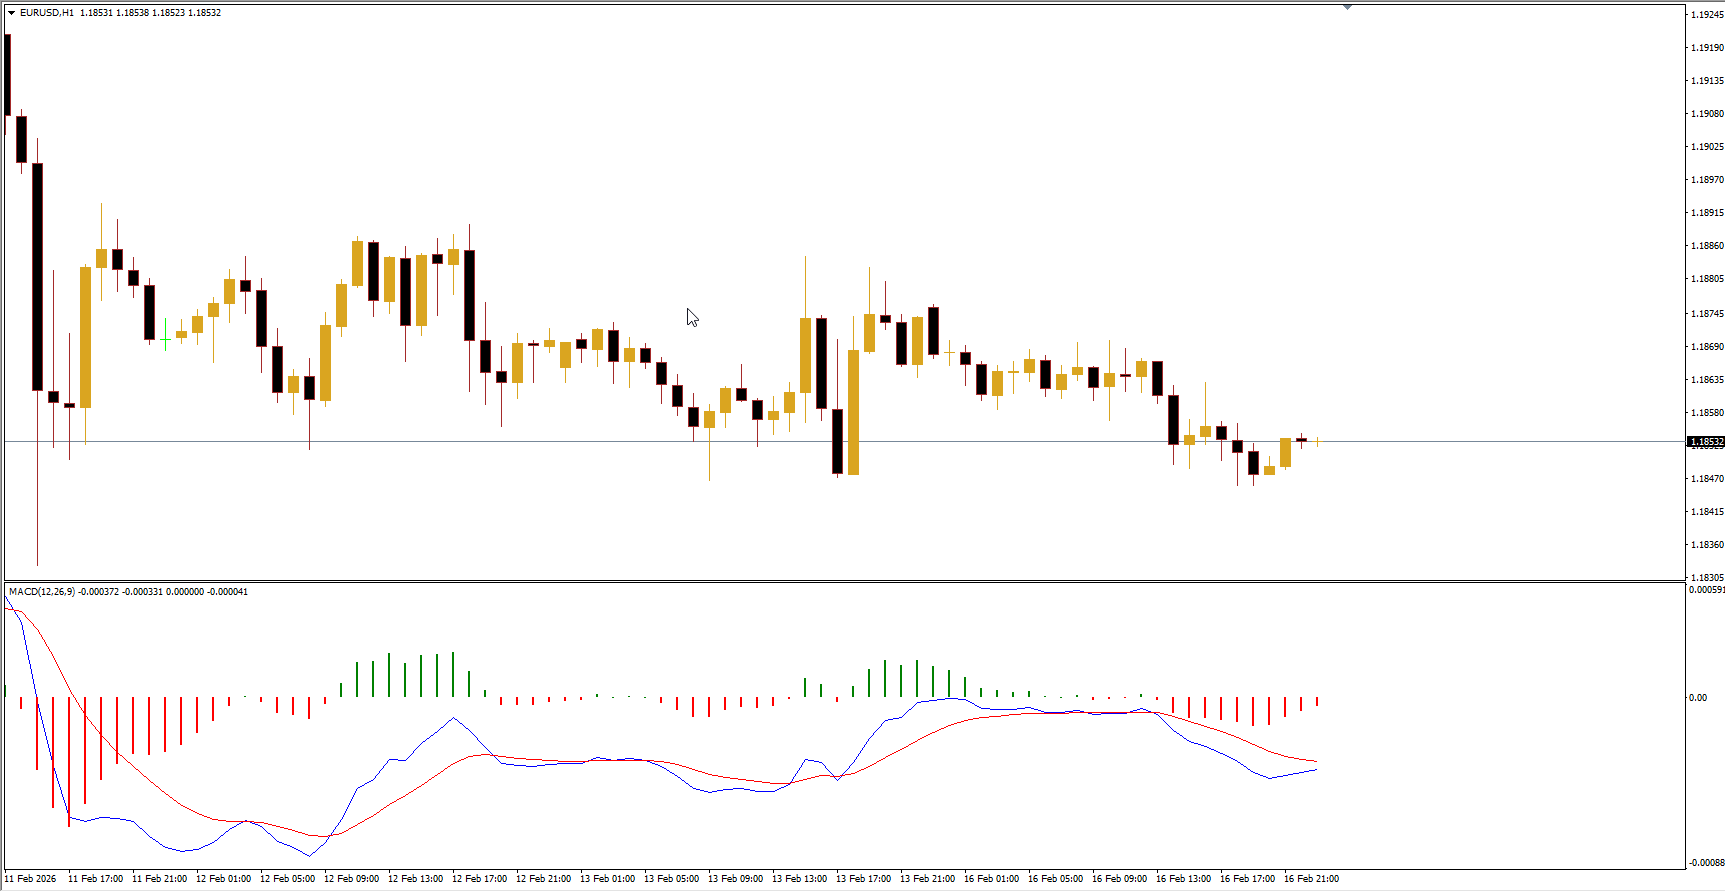
The MACD2Line indicator plots two exponential moving averages (EMA) along with a volume histogram in a separate window of the trading chart. It includes a zero line, which divides the indicator into overbought and oversold zones.
When the EMAs are above the zero line, it signals that the market may be overbought and the trend could reverse downward. Conversely, when the EMAs are below the zero line, the market is oversold, increasing the likelihood of an upward Trend Reversal.
MACD2Line is classified as an oscillator, making it particularly useful during periods of trend changes or reversals. It can complement any trading approach, whether swing trading, intraday trading, or long-term strategies.
Using shorter EMA periods provides more entry points for intraday or swing trading, improving the chance of profitable trades during short-term trend reversals. Longer EMA periods reduce the number of signals but increase reliability for medium- and long-term positions.
Key Features
The MACD2Line indicator has several advantages over the standard MT4 MACD:
It draws two moving averages of different periods and colors: a fast EMA in blue and a slow EMA in red. Entry signals are generated when the fast EMA crosses the slow EMA.
The histogram is color-coded to indicate market direction. Green bars suggest buying opportunities, while red bars signal selling opportunities.
The zero line provides a more effective additional reference for overbought or oversold conditions compared to the standard MACD.
By dividing histogram volumes into bullish and bearish components and adding a second EMA, MACD2Line offers more potential entry points while providing clearer visual signals for trend changes.
Trading Signals and Alerts
While MACD2Line generates bullish and bearish signals, using a secondary tool such as trendlines can improve signal reliability. The AutoTrendLines indicator is commonly used to identify trend direction and confirm trade setups.
For bearish signals, look for the fast EMA crossing below the slow EMA while the histogram is red and the EMAs are in the overbought zone. Sell trades should be considered only if the trendline confirms a continuing downward movement. Stop Loss orders can be placed beyond the trendline, and positions can be closed when oversold readings are reached.
For bullish signals, the fast EMA crossing above the slow EMA while the histogram is green and EMAs are in the oversold zone indicates buying opportunities. Buy trades should be taken while the uptrend line remains intact. Protective stops should be placed beyond the trendline, and positions can be closed when the market reaches overbought levels.
Timeframe Flexibility
MACD2Line works effectively across different timeframes. Whether analyzing short intraday charts or longer-term trends, the indicator adapts to varying periods, providing clear signals for trend reversals and optimal entry points.
Advantages
MACD2Line is a versatile tool for all types of traders. It enhances market analysis by providing more precise signals for trend reversals, clearly indicating overbought and oversold conditions, and offering color-coded histogram volumes for easier interpretation. By combining it with trendlines or other technical analysis tools, traders can significantly improve the accuracy of their entries and exits.
FAQ
Last Update:
Feb 16, 2026 16:36 PM
Published:
Feb 16, 2026 16:23 PM
Category: