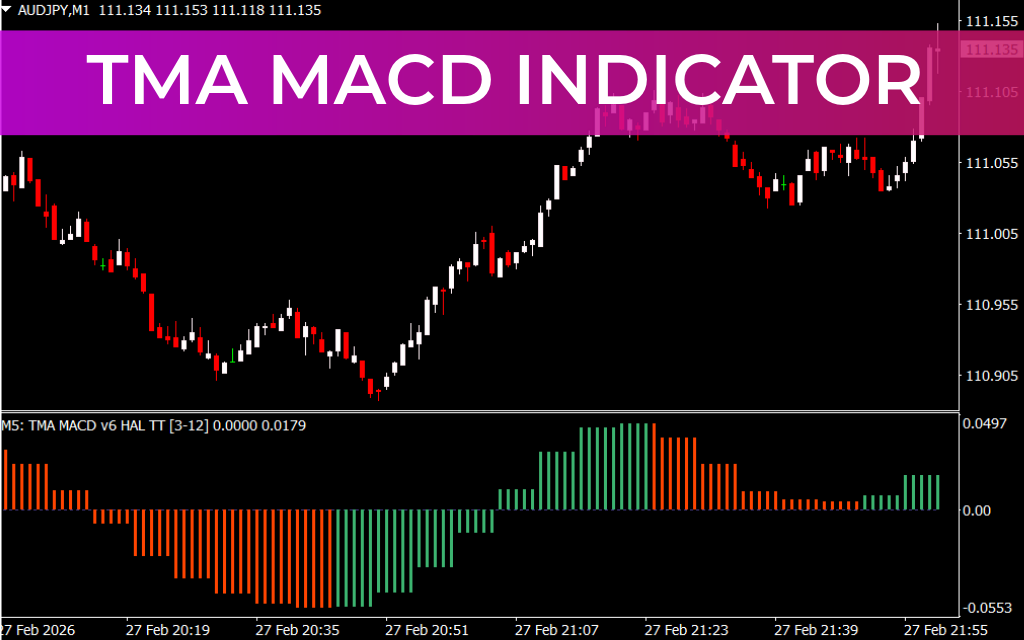
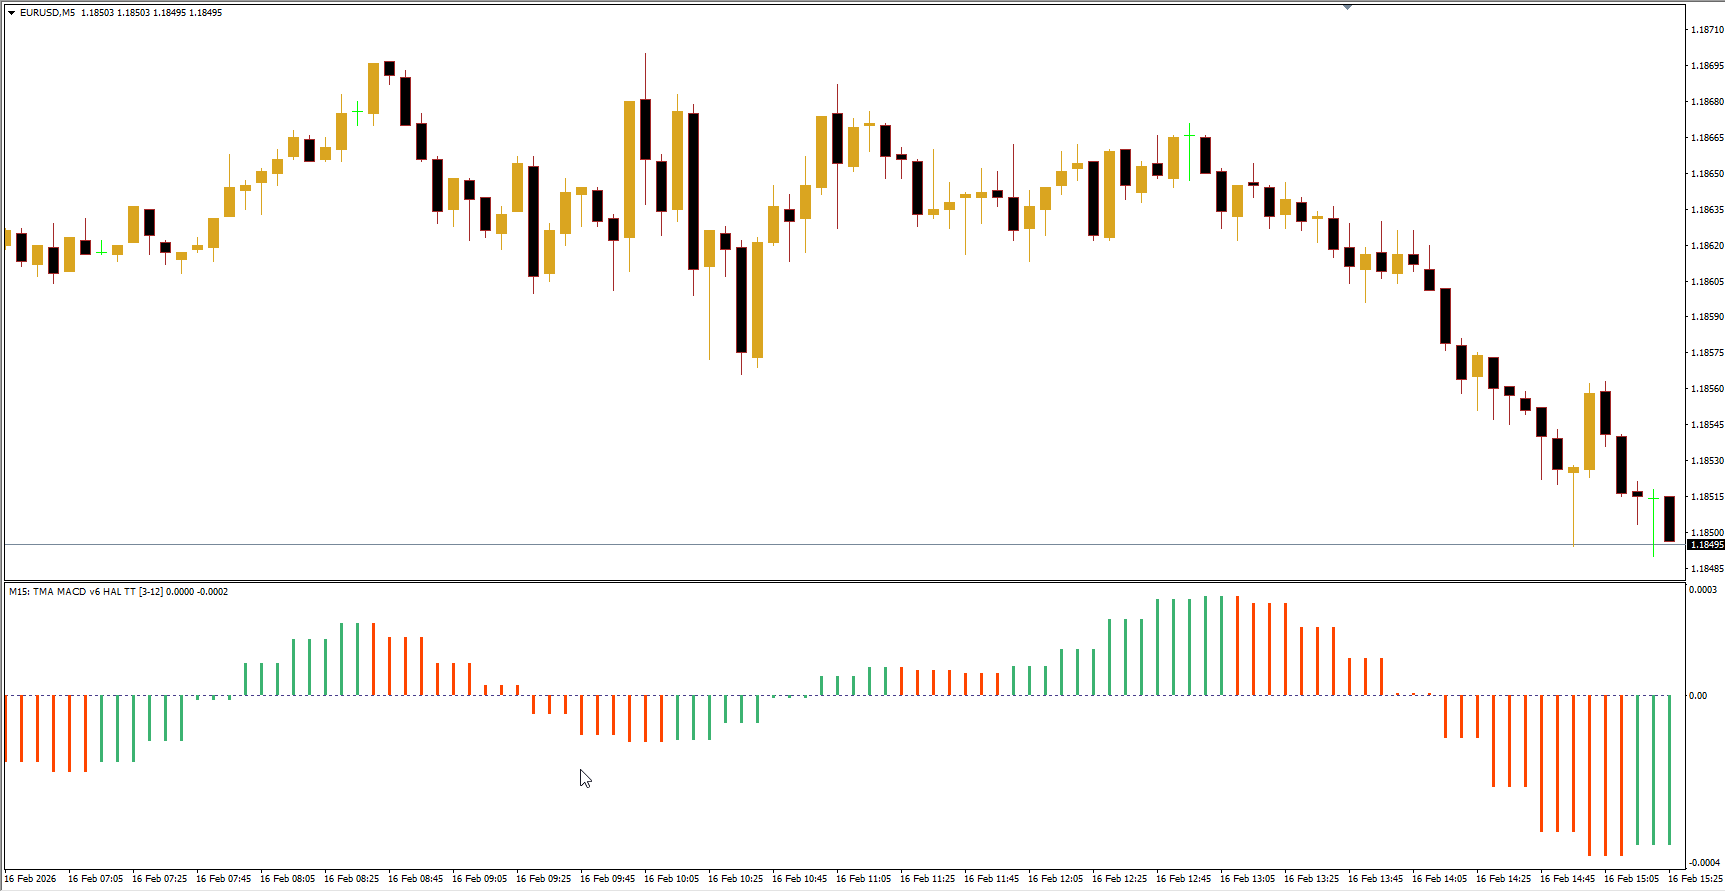
The TMA MACD calculates MACD values using the next higher timeframe relative to the current chart. This approach allows traders to follow the higher timeframe trend while trading smaller fluctuations on the current chart. The indicator is visually represented using colored MACD histograms, making it easy for both beginners and experienced traders to identify trend changes.
How to Trade with the TMA MACD Indicator
Trend-Based Signals
Buy and sell signals are generated when the MACD histogram changes color.
Green histograms indicate bullish momentum, while red histograms indicate bearish momentum.
Following the trend of the higher timeframe improves the probability of profitable trades.
Crossover Signals and Hot Levels
The indicator can generate signals based on MACD crossovers above a predefined Hot level, instead of the traditional zero-line crossover.
Hot levels filter out noise from minor fluctuations, helping traders focus on significant trend changes.
Bullish markets are considered above the Hot level, while bearish markets are below it.
Arrows on the chart indicate buy or sell opportunities when bullish or bearish crossovers occur relative to the Hot level.
Customizing for Success
Hot levels must be adjusted for each currency pair and timeframe, as volatility varies across instruments.
Traders should test and identify optimal Hot levels for their trading instruments to maximize signal reliability.
Advantages of the TMA MACD Indicator
Reduces lag compared to traditional MACD and moving averages
Provides multi-timeframe trend alignment for better trade entries
Colored histogram and arrow signals make trend changes easy to identify
Filters minor market noise with customizable Hot levels
Suitable for higher timeframe trading and swing strategies
Limitations
Performance may be limited during ranging or sideways markets
Hot levels need to be calculated individually for each currency pair and timeframe
Not designed for use across all instruments with a single setting
Conclusion
The TMA MACD Indicator for MT4 successfully combines the responsiveness of TMA with the proven trend-following power of MACD. By reducing lag in moving averages and aligning trades with higher timeframe trends, it provides Forex traders with more accurate signals for entering and exiting positions. It is best suited for trend-following strategies on higher timeframe charts, offering both beginners and experienced traders a reliable tool to enhance trading performance.
FAQ
2 Downloads
Last Update:
Mar 01, 2026 17:03 PM
Published:
Feb 16, 2026 17:20 PM
Category: