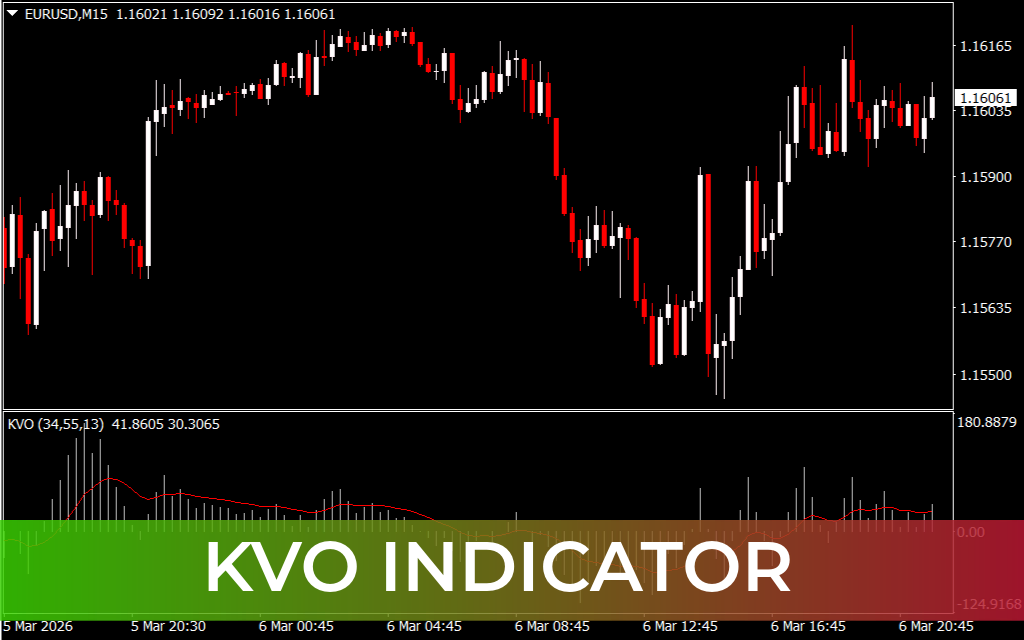
The KVO Indicator for MT4, also known as the Klinger Volume Oscillator, is a momentum-based volume indicator designed to analyze the relationship between price movement and market volume. It visually resembles the MACD indicator but uses a different calculation method to determine the true strength of market trends.
The indicator processes market data through a specialized algorithm that evaluates the volume force behind price trends. It then displays the result as a histogram with a signal line, helping traders identify the dominant market bias and potential reversal zones.
The KVO indicator works on the MetaTrader 4 platform and can be applied to various markets including forex, stocks, and cryptocurrencies.
How the KVO Indicator Works
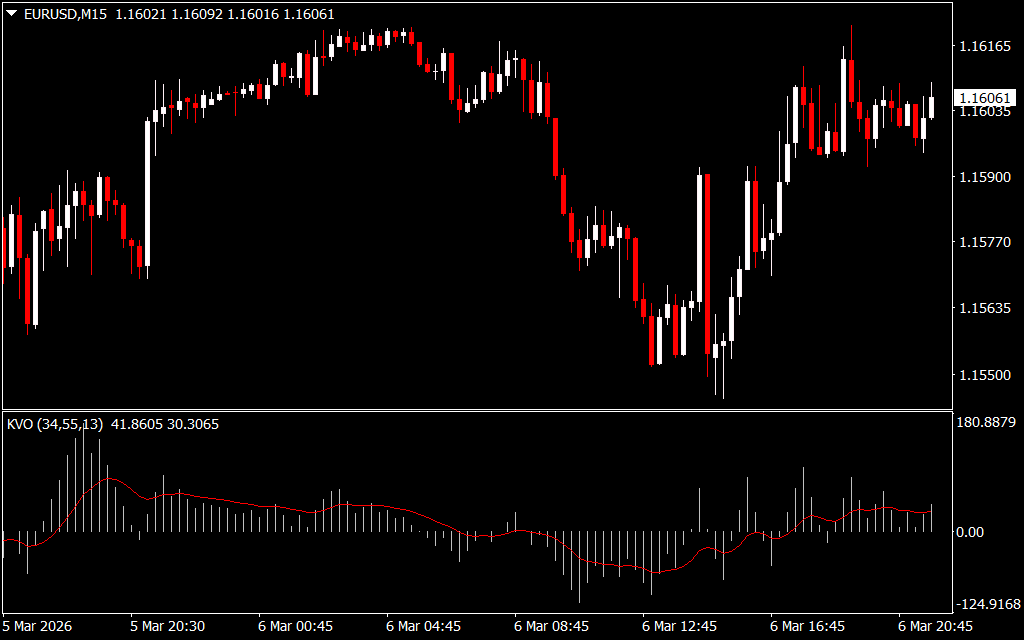
The KVO indicator appears in a separate window below the chart and consists of two main elements:
1. Histogram Bars
- Above the Zero Line → Indicates bullish market momentum
- Below the Zero Line → Indicates bearish market momentum
The histogram shows the strength of the trend based on volume flow.
2. Signal Line (Red Line)
The signal line acts as a confirmation tool:
- When the signal line crosses above the zero line, it confirms bullish sentiment.
- When it crosses below the zero line, it confirms bearish sentiment.
These signals help traders identify trend continuation or potential reversal opportunities.
Example Trading Setup
Consider a trade setup on the **EUR/USD currency pair in the H4 timeframe.
- The overall Market Structure shows a downtrend.
- The KVO histogram bars move below the zero line, confirming bearish momentum.
- The signal line also drops below the zero line, strengthening the bearish bias.
- Price forms a bearish order block and retests it.
This combination of Price Action and KVO confirmation provides a high-probability sell setup.
Best Way to Use the KVO Indicator
Although the KVO indicator is powerful for analyzing trend direction and volume strength, it performs best when combined with other trading tools.
Recommended confirmations include:
- Support And Resistance levels
- Price action patterns
- Moving averages
- Market structure analysis
Combining these tools helps traders filter out false signals and improve trade accuracy.
Key Features of the KVO Indicator
- Volume-based Trend Strength analysis
- Histogram visualization for market momentum
- Signal line for Trend Confirmation
- Helps identify trend reversals and continuation
- Works on all timeframes
- Suitable for scalping, day trading, and intraday trading
- Beginner-friendly yet useful for advanced traders
Who Should Use the KVO Indicator?
The KVO indicator is ideal for traders who want to understand the volume strength behind price movements.
It is commonly used by:
- Scalpers analyzing short-term momentum
- Day traders seeking intraday trend confirmation
- Technical analysts studying volume-based indicators
Because it combines trend direction and volume analysis, it helps traders make more informed trading decisions.
Conclusion
The KVO Indicator (Klinger Volume Oscillator) for MT4 is a powerful volume-based tool that helps traders identify the true strength of market trends and possible reversal zones. By analyzing the relationship between volume force and price movement, the indicator provides valuable insight into market sentiment.
When combined with price action and other technical indicators, the KVO can significantly improve trend confirmation and trade timing.
FAQ
Published:
Mar 06, 2026 15:58 PM
Category: