The FNCD Indicator for MT4 is a powerful trend-following tool designed to identify potential price reversal zones in the market. Developed for the MetaTrader 4 platform, this indicator uses an algorithm that analyzes how price reacted to specific levels in the past to determine possible future turning points.
By studying historical price behavior, the FNCD indicator helps traders detect shifts in market momentum and trend direction. This makes it useful for spotting both continuation trends and potential reversals.
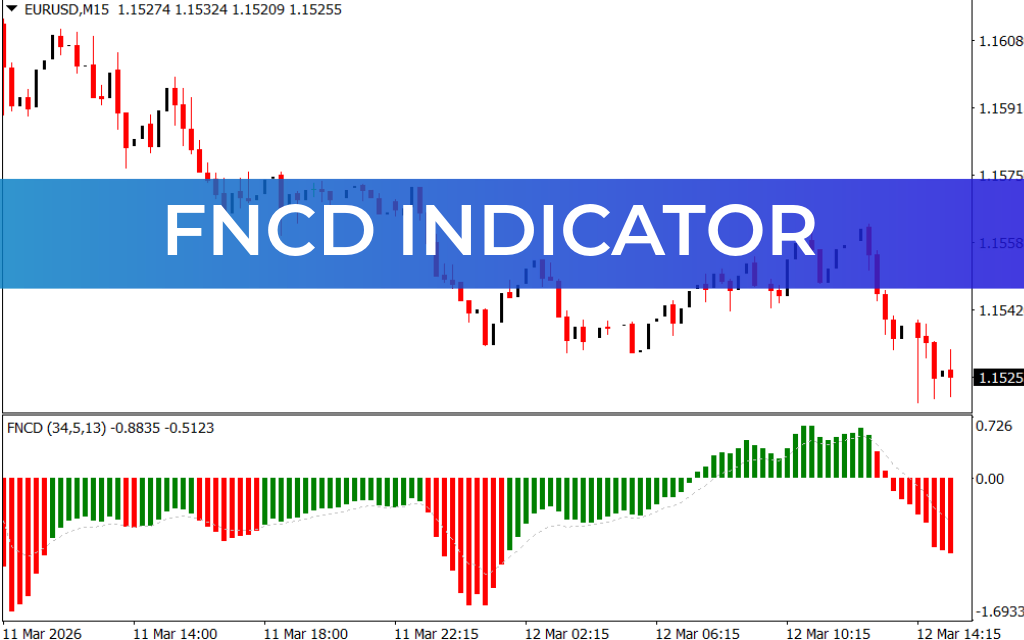
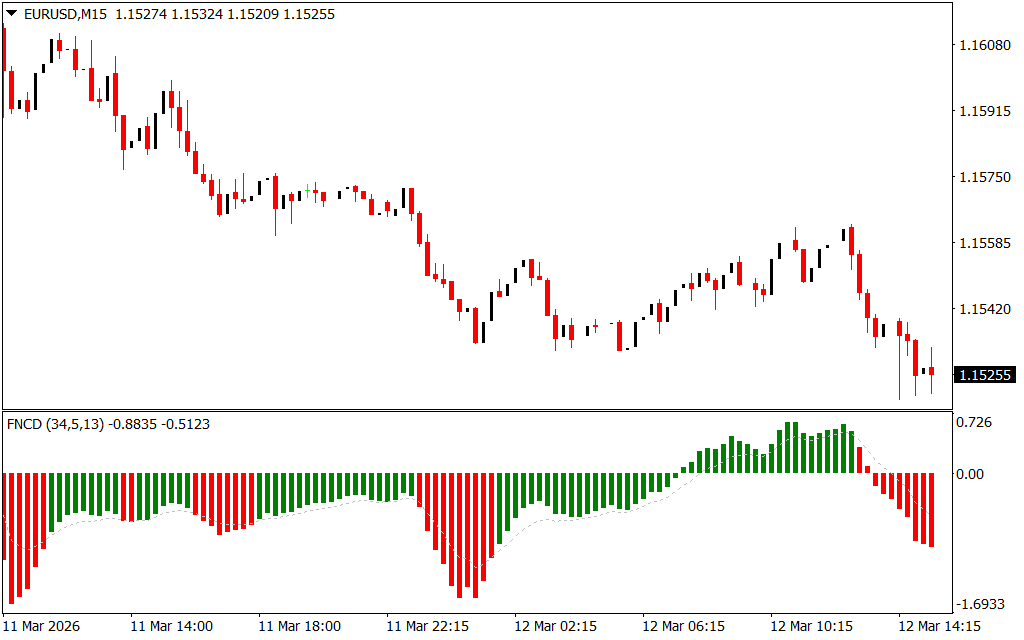
The indicator appears in a separate window below the main chart and displays color-coded histogram bars along with a 0.00 center line, which acts as the dividing point between bullish and bearish market conditions.
How the FNCD Indicator Works
The FNCD indicator uses a histogram system to visually display market sentiment.
- Green Histogram Bars – Indicate bullish momentum
- Red Histogram Bars – Indicate bearish momentum
The 0.00 center level plays a crucial role in defining the current trend:
- Above 0.00 – Bullish market sentiment
- Below 0.00 – Bearish market sentiment
This structure makes it easy for traders to quickly determine whether the market favors buying or selling.
Trading Timeframes and Usage
The FNCD indicator is versatile and works effectively across multiple trading styles:
- Scalping
- Intraday trading
- Swing trading
However, for day trading, many traders prefer generating signals on the H4 timeframe because it tends to provide more reliable trend confirmations.
The indicator can also be used as a standalone trading tool, although combining it with Price Action analysis or additional technical indicators can significantly improve signal accuracy.
FNCD Buy Signal
A buy signal occurs when the following conditions are met:
- The indicator begins printing green histogram bars.
- The bars appear above the 0.00 center line.
- Price action confirms the signal with a bullish candlestick pattern, such as a bullish Engulfing Pattern.
When these signals align, traders may consider entering a long position.
FNCD Sell Signal
A sell signal occurs when:
- The indicator prints red histogram bars.
- The bars appear below the 0.00 center line.
- Price action confirms the setup with a bearish pattern, such as a bearish order block or bearish engulfing candle.
This combination signals increasing bearish momentum and a potential short trading opportunity.
Advantages of the FNCD Indicator
Traders favor the FNCD indicator because of its simplicity and effectiveness.
Key benefits include:
- Clear color-coded trend signals
- Helps detect potential Trend Reversal zones
- Suitable for multiple trading styles
- Works on various timeframes and instruments
- Easy to combine with price action strategies
Conclusion
The FNCD Indicator for MT4 is a reliable trend-following tool that helps traders identify market direction and potential reversal zones through histogram-based signals. By analyzing historical price reactions and displaying clear bullish and bearish momentum, the indicator simplifies technical analysis for both beginners and experienced traders.
When used together with price action patterns and proper risk management, the FNCD indicator can help traders improve their entry timing and overall trading performance.
FAQ
Published:
Mar 12, 2026 10:27 AM
Category: