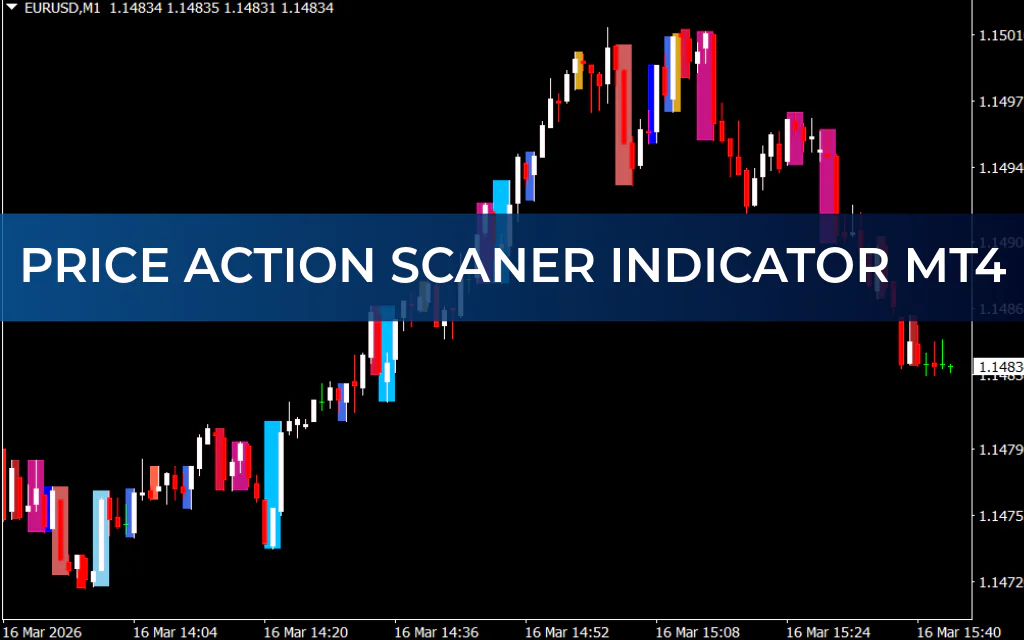
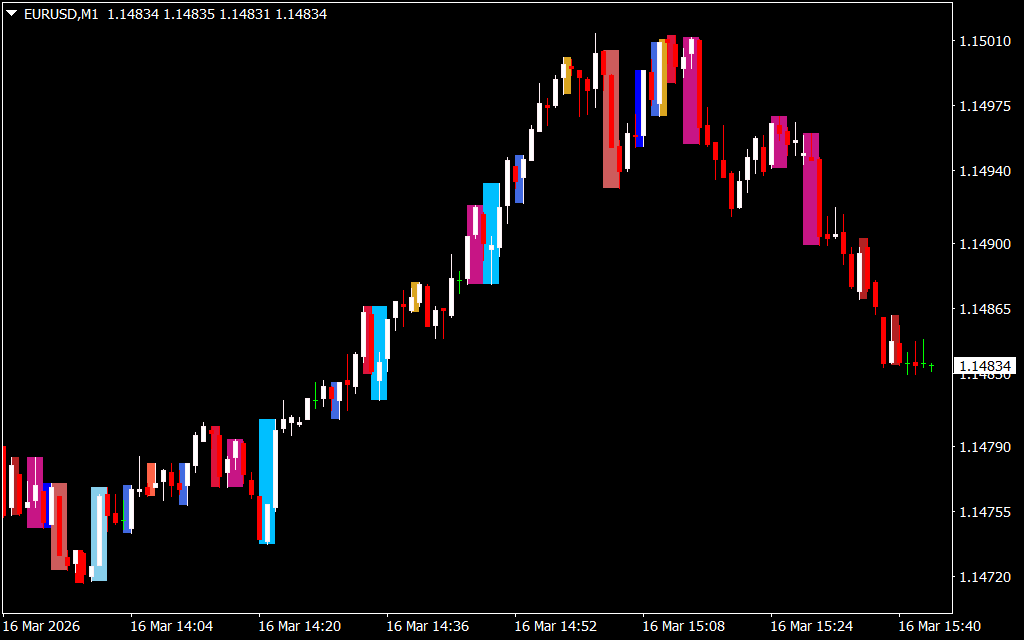
The PriceAction Scanner Indicator for MT4 is a powerful tool designed to automatically detect Price Action patterns directly on your trading charts. Since MetaTrader 4 does not include built-in tools for price action analysis, this indicator fills that gap by scanning charts and highlighting important candlestick formations and trading setups.
Price action trading focuses on analyzing raw price movements rather than relying heavily on technical indicators or automated trading systems. The PriceAction Scanner simplifies this process by automatically identifying key price patterns for traders.
1. Why Use Price Action in Trading
Price Action is a trading approach that relies only on market price movements to make trading decisions. Instead of using complex indicators or algorithms, traders analyze candlestick patterns, chart structures, and market behavior.
Advantages of Price Action Trading
- Uses pure price data without lagging indicators
- Helps identify trend reversals and continuations
- Works well with Support And Resistance levels
- Suitable for all trading styles
While MetaTrader provides many indicators and Expert Advisors, it offers very few built-in tools for price action analysis. The PriceAction Scanner indicator solves this problem by automatically detecting price patterns.
2. Features of the PriceAction Scanner Indicator
The PriceAction Scanner analyzes the chart and automatically highlights seven important price action patterns across all timeframes.
It works on M1 to monthly charts, though higher timeframes usually produce more reliable signals due to reduced market noise.
Price Action Patterns Detected by the Indicator
1. DBHLC & DBLHC Pattern
(Double Bar High Lower Close / Double Bar Low Higher Close)
This pattern consists of two candlesticks with similar highs or lows.
- DBHLC (Bearish Setup)
Second candle closes lower than the first. - DBLHC (Bullish Setup)
Second candle closes higher than the first.
These patterns typically appear during strong trends and signal trend continuation.
2. TBH & TBL Pattern
(Two Bars High / Two Bars Low)
This pattern forms when two candles share the same high or low.
It usually appears at market extremes and may indicate trend exhaustion or reversal.
This means the current trend might lose strength.
3. RAIL Pattern
The Railway Track pattern consists of two long candles moving in opposite directions.
Characteristics:
- Long candle bodies
- Short shadows
It shows strong market participation and can signal trend continuation or reversal depending on its location on the chart.
4. OVB Pattern (Engulfing Pattern)
The OVB pattern is essentially a bullish or bearish engulfing pattern.
It includes two candles:
- Bullish Engulfing:
The second candle opens lower and closes higher than the first candle. - Bearish Engulfing:
The second candle opens higher and closes lower than the first candle.
The second candle completely engulfs the body of the first candle.
This pattern often signals Trend Reversal.
5. PPR Pattern
(Reversal Pivot Point)
The PPR pattern consists of three candlesticks.
Characteristics:
- The third candle creates a new extreme
- It does not close beyond the previous candle's high/low
This pattern usually signals a potential market reversal.
6. Pin Bar Pattern
A Pin Bar is a candle with:
- Long shadow (wick)
- Small body
- Opening and closing prices close together
It often signals strong rejection of price levels and indicates trend reversals.
Pin bars are one of the most popular price action signals among traders.
7. WRB Pattern
(Wide Range Bar)
The Wide Range Bar pattern highlights candles with significantly larger ranges compared to surrounding candles.
It usually forms when a retracement ends and the main trend resumes.
How to Use the PriceAction Scanner
Step 1 – Identify the Pattern
The indicator automatically marks patterns on the chart.
Step 2 – Confirm the Setup
Combine the pattern with:
- Support and resistance levels
- Trendlines
- Other indicators
Step 3 – Enter the Trade
Enter trades once the pattern aligns with your trading strategy or Market Structure.
Best Timeframes for Price Action
| Trading Style | Recommended Timeframe |
|---|---|
| Scalping | M5 – M15 |
| Intraday Trading | M15 – H1 |
| Swing Trading | H1 – H4 |
| Position Trading | Daily |
Higher timeframes generally provide more reliable signals.
Pros and Cons
✅ Pros
- Automatically detects price action patterns
- Works on all timeframes
- Reduces time spent analyzing charts
- Useful for both beginners and experienced traders
❌ Cons
- Requires manual confirmation
- Some patterns may appear during market noise on lower timeframes
Conclusion
The PriceAction Scanner Indicator for MT4 is a valuable tool for traders who rely on price action analysis. By automatically detecting key candlestick formations like Pin Bars, Engulfing patterns, Railway Tracks, and Wide Range Bars, it simplifies the process of identifying trading opportunities.
Although it should not be used alone, combining it with support and resistance levels, trendlines, or other indicators can significantly improve trading accuracy.
Because it works on all timeframes, the PriceAction Scanner can be used effectively in scalping, intraday trading, swing trading, and long-term strategies.
FAQ
5 Downloads
Published:
Mar 16, 2026 10:46 AM
Category: