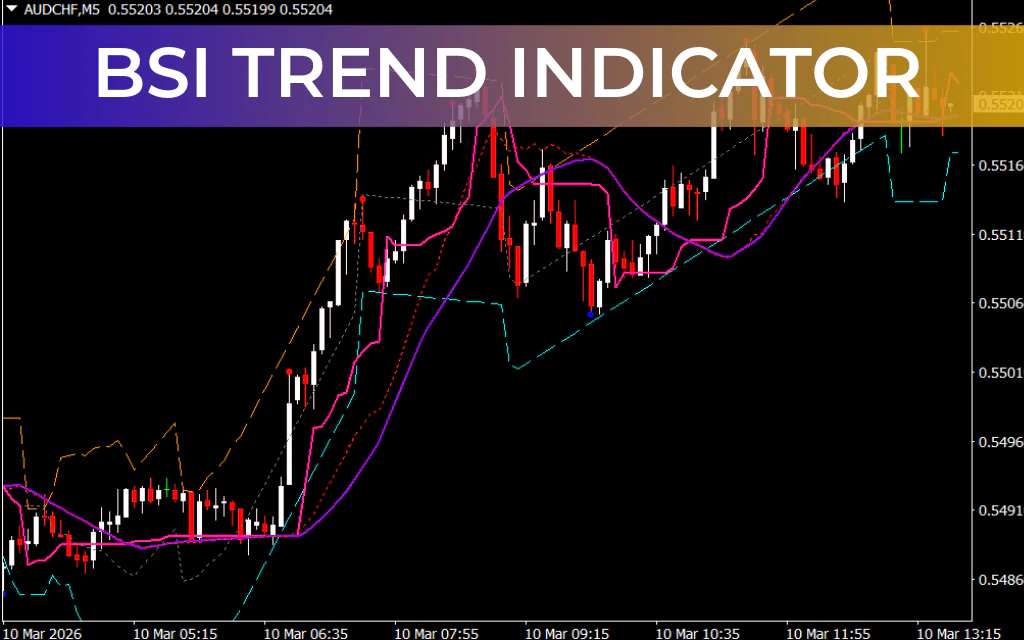
The BSI Trend Indicator for MT4 is a powerful yet easy-to-use trend analysis tool that helps traders identify market direction using a channel-based system. BSI stands for Bar Strength Index, which measures the overall strength of price bars to determine the underlying market trend.
Unlike many traditional indicators that rely on a single line or oscillator, the BSI Trend Indicator plots multiple lines that form a structured price channel. These lines act as dynamic Support And Resistance levels, helping traders recognize potential entry and exit opportunities.
The indicator’s visual structure is somewhat similar to the trend lines used in the Ichimoku Cloud system, but it focuses primarily on measuring bar strength and trend movement. Because of its clear channel layout and signal dots, it is suitable for both beginner and experienced traders.
Although the BSI Trend Indicator can be applied to any timeframe, it generally performs best on higher timeframes such as H4, Daily, and Weekly charts, where market trends are more reliable.
BSI Trend Indicator Channel Structure
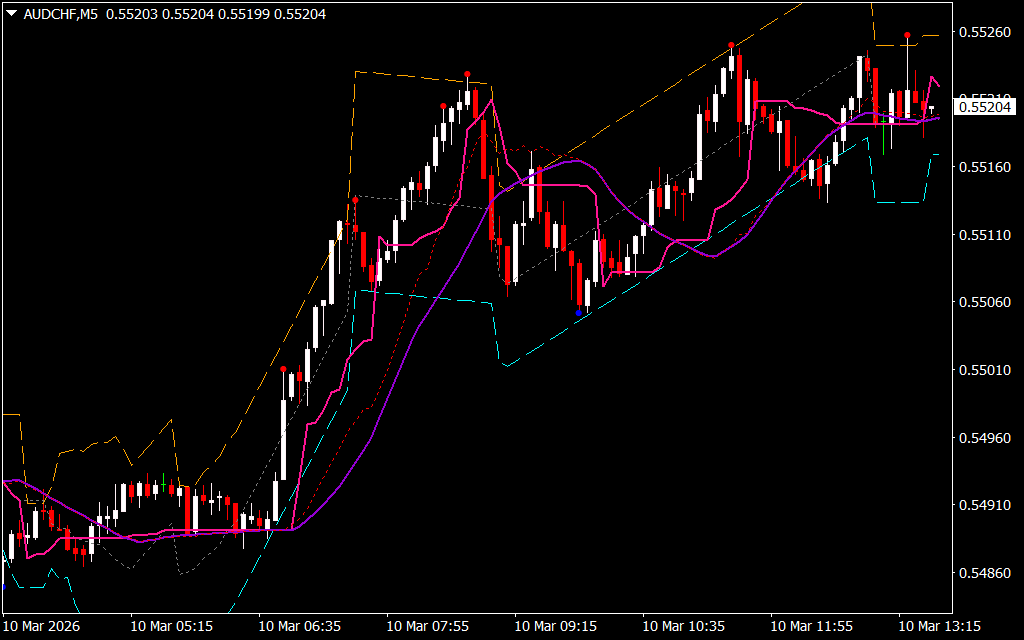
The indicator forms a trend channel using several key lines:
- Trend High Line (Yellow): Represents the upper boundary of the channel and potential resistance.
- Tango Line: A secondary trend guide that helps define market direction.
- Trend Regression Line: Indicates the overall trend direction based on price strength.
- Tango MA Line: A moving average–based support or resistance guide.
- Trend Low Line: The lower boundary of the channel and potential support.
Together, these lines create a channel that reflects the current trend and provides traders with important price levels for decision-making.
In addition to the channel, the indicator plots colored dots directly on the chart to signal potential trade entries and exits, making the indicator easier to interpret.
BSI Trend Indicator Buy and Sell Signals
Buy Signal
A buy signal occurs when the price moves below the lower blue line of the channel. When the indicator prints a blue dot, it confirms bullish momentum and signals a potential uptrend.
At this point, traders may consider opening long positions while monitoring the channel for support levels.
Sell Signal
A sell signal appears when the price moves above the yellow Trend High line and the indicator prints a red dot. This combination indicates potential bearish momentum and the beginning of a downtrend.
Traders may consider opening short positions once the signal is confirmed.
If the price crosses above or below the channel lines but no dot appears, traders should wait for confirmation before entering a trade.
Improving Signal Accuracy
While the BSI Trend Indicator provides strong visual signals, traders often combine it with other technical indicators for additional confirmation. Popular options include:
- RSI (Relative Strength Index) for momentum confirmation
- MACD for Trend Strength and crossover signals
- Moving Averages to confirm the overall market direction
Using these indicators together can help reduce false signals and improve trade accuracy.
What is BSI in Trading?
BSI stands for Bar Strength Index, a metric used to measure the strength of price bars within a given period. It evaluates whether buyers or sellers dominate the market during that time.
The BSI Trend Indicator expands on this concept by combining bar strength analysis with multiple trendlines to create a channel that visually represents market direction.
Best Trend Indicators for Forex
No trading indicator is completely reliable on its own. However, several trend indicators are widely used by forex traders because of their consistency. These include:
- Relative Strength Index (RSI)
- Moving Averages
- MACD (Moving Average Convergence Divergence)
- Bollinger Bands
- BSI Trend Indicator
Combining multiple indicators often provides stronger confirmation and improves trading decisions.
Conclusion
The BSI Trend Indicator for MT4 is a versatile tool that uses multiple trendlines to form a channel that highlights market direction and potential trade opportunities. With clear support and resistance zones and easy-to-read signal dots, it simplifies the process of identifying buy and sell opportunities.
Traders can enter positions when the price breaks above or below the channel and confirm the signal with the indicator’s dots. When combined with proper risk management and additional indicators, the BSI Trend Indicator can become a valuable part of any forex trading strategy.
FAQ
Published:
Mar 10, 2026 08:36 AM
Category: