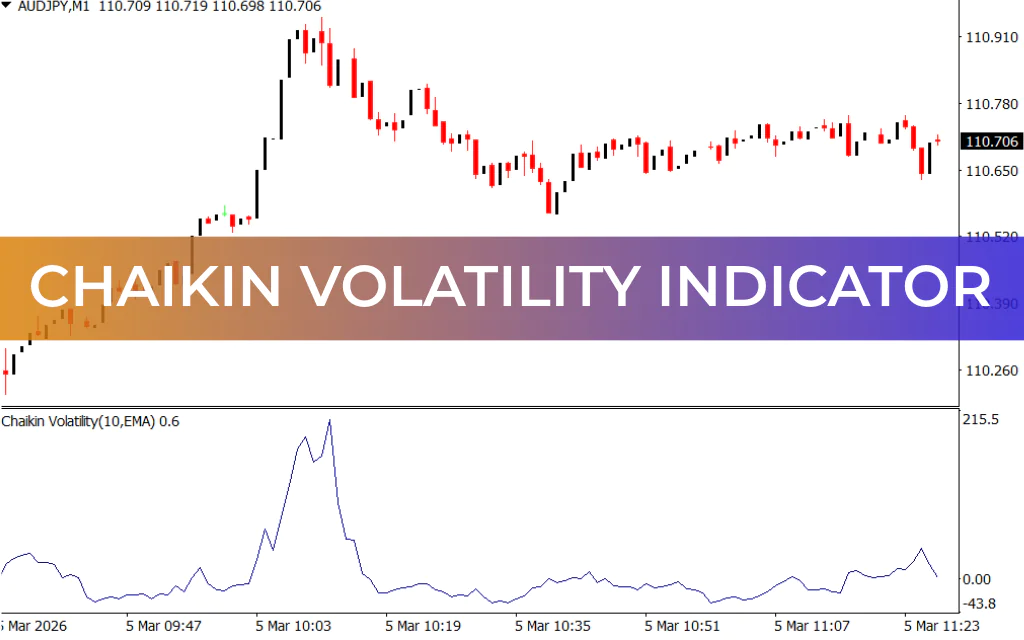
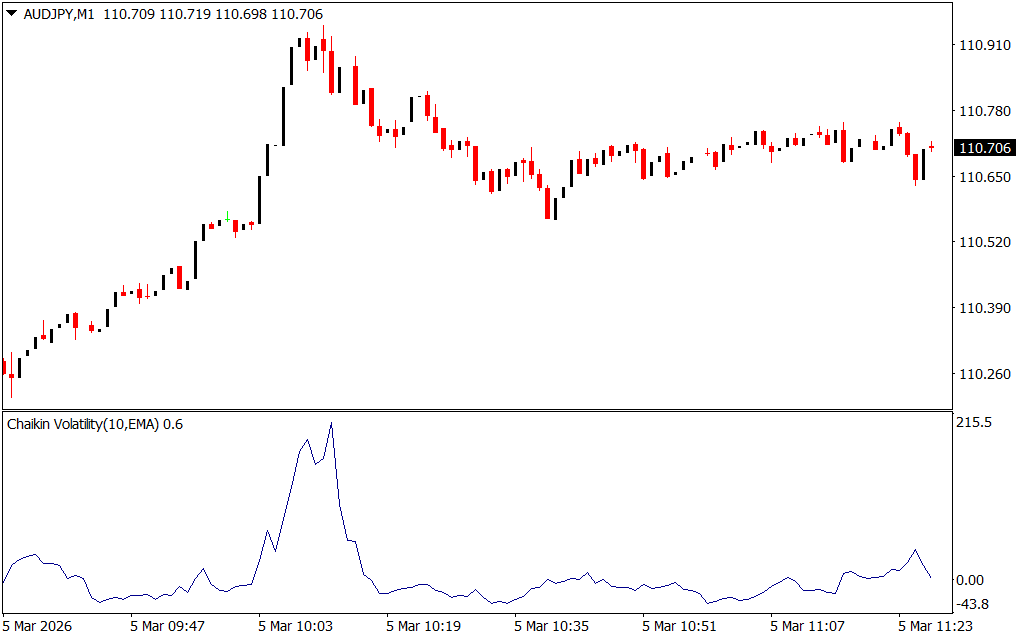
The Chaikin’s Volatility Indicator for MT4 is a technical analysis tool used to measure market volatility and identify potential trend changes. It helps forex and stock traders evaluate the strength of price movements and detect possible bullish or bearish momentum shifts.
The indicator is closely associated with concepts used in the Moving Average Convergence Divergence (MACD) and the Accumulation/Distribution line, allowing traders to analyze underlying market activity rather than relying solely on closing prices.
By monitoring volatility and accumulation behavior, traders can gain deeper insights into whether buyers or sellers are gaining control of the market.
How the Chaikin’s Volatility Indicator Works
The Chaikin’s Volatility Indicator evaluates price ranges and market momentum to determine whether volatility is expanding or contracting.
Key ideas behind the indicator include:
- Measuring changes in price volatility over a specified period
- Identifying momentum direction in the market
- Detecting bullish or bearish divergences
Traders often combine the indicator with accumulation-distribution analysis to understand whether buying or selling pressure is increasing.
Buy and Sell Signals
The indicator primarily generates signals based on divergence and center-line crossovers.
Buy Signal
A bullish signal occurs when:
- The accumulation-distribution line crosses above the center line.
- Positive divergence appears in the indicator.
- Increasing accumulation suggests buyers are entering the market.
This scenario indicates a potential upward price movement and a possible buying opportunity.
Sell Signal
A bearish signal occurs when:
- The center line crosses below the accumulation-distribution line.
- The indicator shows negative divergence.
- Market distribution increases, suggesting stronger selling pressure.
This condition signals a potential downward price movement and a possible selling opportunity.
Understanding Divergence
Divergence plays a key role when using the Chaikin’s Volatility Indicator.
- Positive Divergence
- Indicates rising accumulation.
- Suggests that prices may increase soon.
- Negative Divergence
- Shows stronger distribution.
- Suggests that prices may decline in the near future.
Divergence signals often appear before significant price movements, helping traders anticipate market reversals.
Key Benefits
- Measures market volatility and momentum strength
- Helps detect bullish and bearish divergences
- Improves Trend Confirmation when combined with other indicators
- Suitable for forex and stock trading
- Works across multiple MT4 timeframes
Conclusion
The Chaikin’s Volatility Indicator for MT4 is a useful tool for analyzing market momentum and identifying potential trading opportunities. By monitoring volatility changes and accumulation-distribution behavior, traders can anticipate trend shifts more effectively.
For the best results, combine this indicator with other technical tools such as trend indicators, support/resistance levels, or Price Action analysis to confirm buy and sell signals.
FAQ
1 Download
Published:
Mar 05, 2026 05:29 AM
Category: