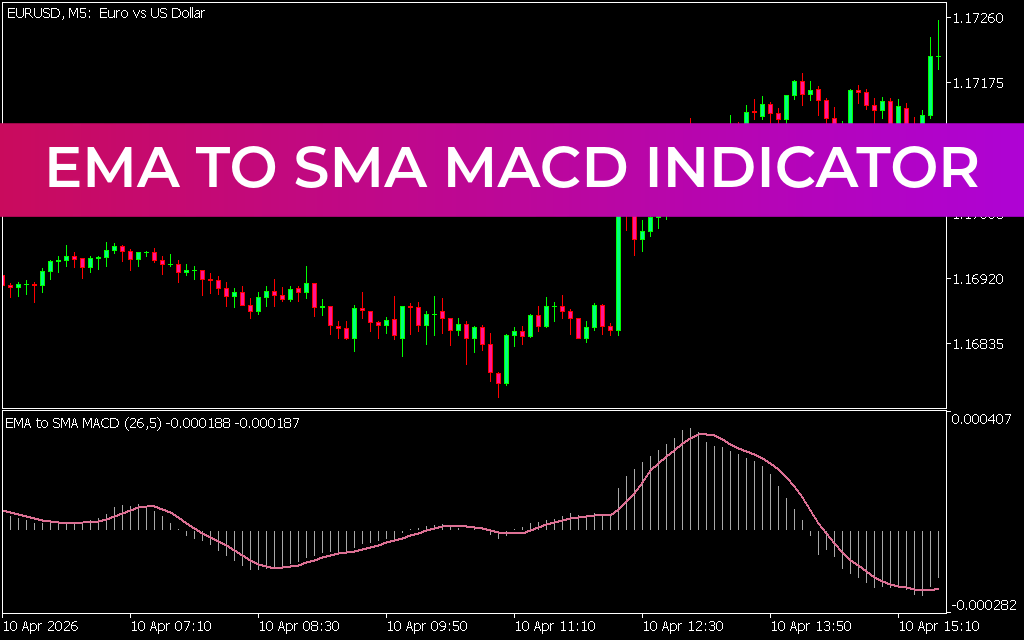
The EMA to SMA MACD Indicator for MT5 is a powerful hybrid technical analysis tool that combines Exponential Moving Averages (EMA), Simple Moving Averages (SMA), and the MACD (Moving Average Convergence Divergence) framework to identify trend direction, momentum strength, and potential trade signals.
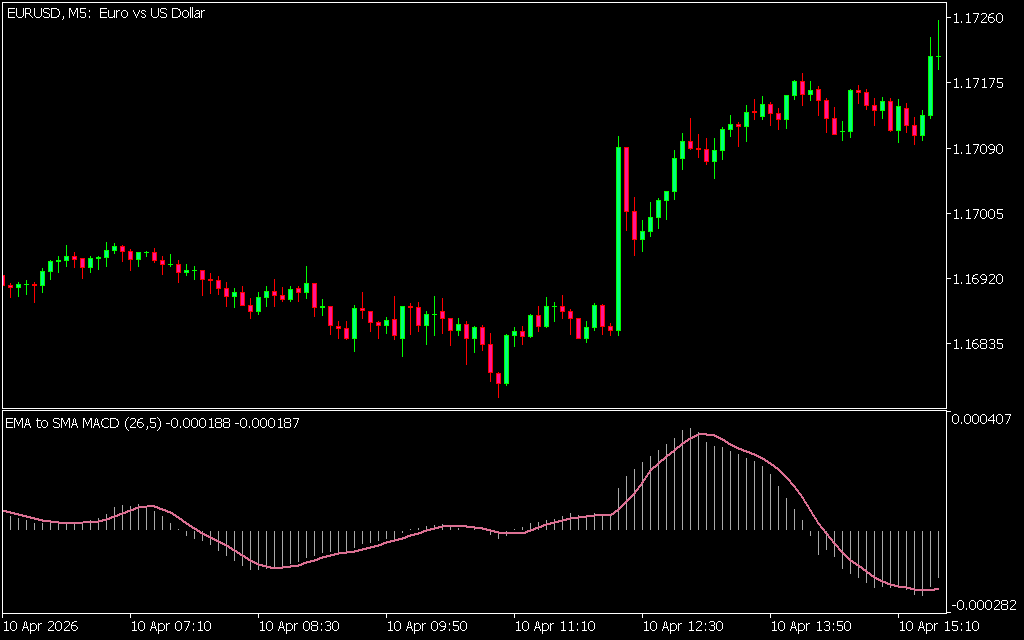
By merging these moving average techniques, the indicator provides clearer BUY and SELL signals along with improved trend visualization through a signal line and histogram.
What Is the EMA to SMA MACD Indicator?
This indicator enhances the traditional MACD by integrating both EMA and SMA calculations into its signal structure.
It consists of:
- A MACD signal line (based on EMA/SMA interaction)
- A histogram showing momentum strength
- Two moving average components (EMA and SMA hybrid logic)
The result is a more adaptive indicator that reflects both short-term momentum and longer-term trend direction.
Key Features of EMA to SMA MACD Indicator for MT5
- Combines EMA, SMA, and MACD principles
- Displays signal line and histogram for trade decisions
- Identifies trend continuation and reversals
- Highlights bullish and bearish momentum zones
- Works on all forex pairs and timeframes
- Suitable for Scalping, intraday, and swing trading
How the EMA to SMA MACD Works
The indicator compares moving averages and plots:
- Histogram above zero: bullish momentum
- Histogram below zero: bearish momentum
- Expanding bars: strengthening trend
- Shrinking bars: weakening trend
The signal line helps confirm whether momentum is increasing or reversing.
BUY and SELL Signals
Buy Signal
A BUY setup occurs when:
- Histogram moves below zero and begins to reverse upward
- Bars cross above the signal line
- Bullish momentum starts building
Entry: Enter long after confirmation from signal line crossover
Stop Loss: Below recent swing low
Exit: When histogram weakens or crosses below signal line
Sell Signal
A SELL setup occurs when:
- Histogram moves above zero and starts declining
- Bars fall below the signal line
- Bearish momentum strengthens
Entry: Enter short after bearish confirmation
Stop Loss: Above recent swing high
Exit: When histogram reverses upward or crosses signal line
How to Use EMA to SMA MACD Effectively
To improve trading accuracy:
- Trade in the direction of the higher timeframe trend
- Use histogram strength to confirm momentum
- Avoid sideways market conditions
- Combine with Price Action signals for better entries
Best Timeframes
The indicator performs best on:
- H1 for intraday trading
- H4 for swing trading
- Daily charts for trend analysis
Higher timeframes reduce noise and false signals.
Recommended Indicator Combinations
For stronger confirmation, combine with:
- RSI (momentum confirmation)
- Moving Averages (trend direction)
- Support & Resistance levels
- Candlestick patterns
Limitations
- Can lag in very fast-moving markets
- Produces false signals in sideways conditions
- Requires confirmation for best accuracy
- Works best when aligned with trend direction
Conclusion
The EMA to SMA MACD Indicator for MT5 is a versatile hybrid tool that combines multiple moving average techniques with MACD analysis to deliver clearer trend and momentum signals. It helps traders identify entry and exit points with improved precision.
When used alongside price action and proper risk management, it becomes a strong addition to any forex trading strategy.
Published:
Apr 13, 2026 08:49 AM
Category: