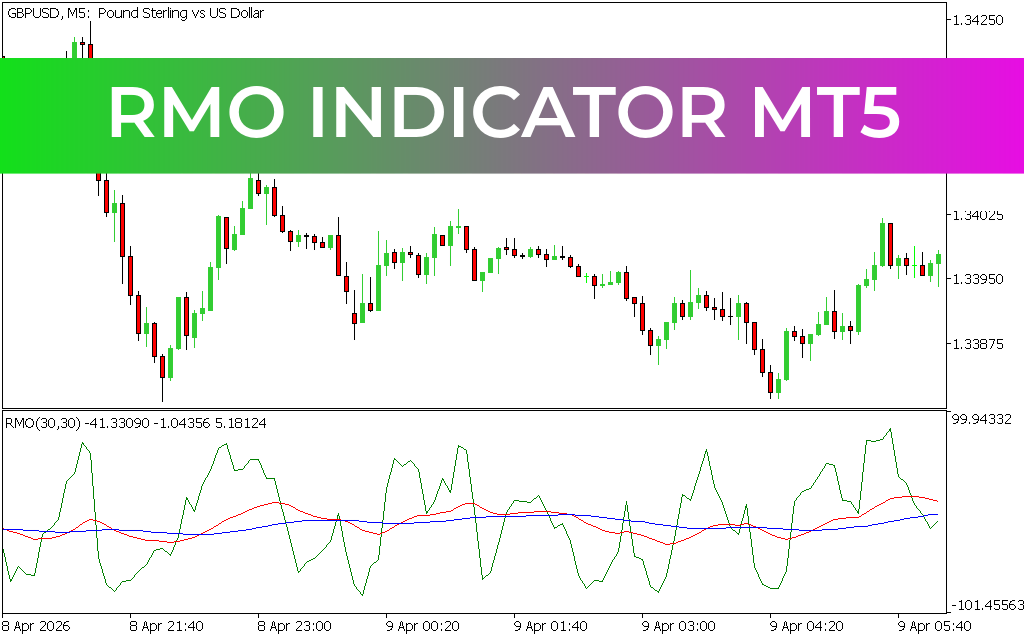
The Rahul Mohindar Oscillator (RMO) Indicator for MT5 is a trend-following technical tool designed to identify the primary market direction and highlight potential reversal zones. By combining smooth moving averages with histogram bars, the RMO provides traders with clear insights into bullish and bearish momentum. Its easy-to-interpret signals make it suitable for novice, intermediate, and advanced forex traders.
How It Works
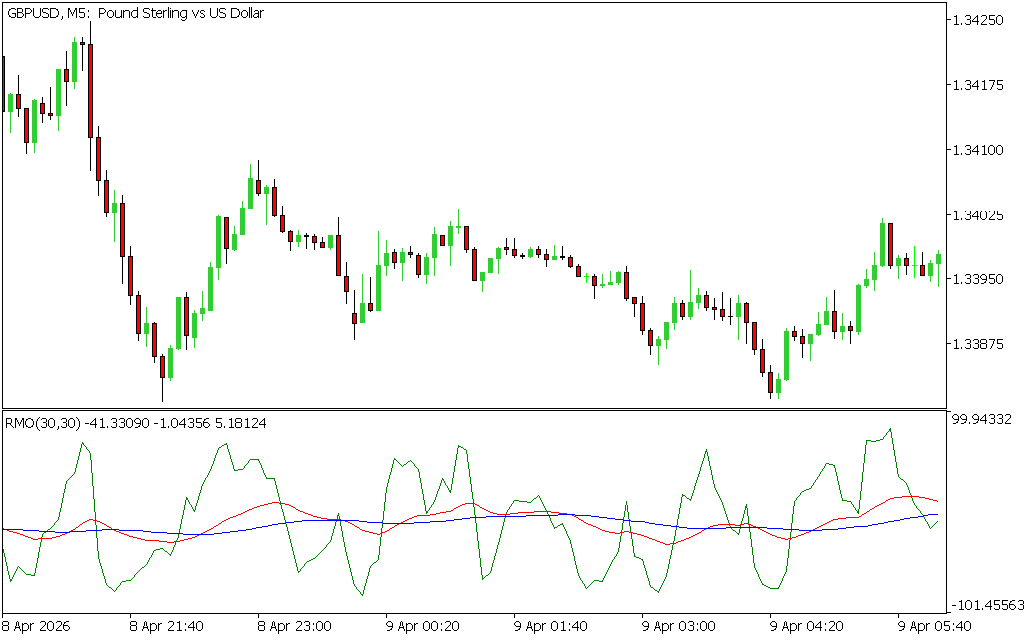
- Moving Averages: Signal lines (green and dotted) track the slope of the trend.
- Histogram Bars: Oscillate between positive and negative zones around the zero level, refining trend direction.
- Trend Reversal Signals: Generated when signal lines cross above or below the histogram.
- Momentum Analysis: Histogram bars help gauge the strength of the trend.
Trading Signals
- Bullish Setup: Signal lines cross above the histogram → potential buy opportunity.
- Bearish Setup: Signal lines cross below the histogram → potential sell opportunity.
- Confirmation: Stronger when combined with Price Action patterns such as supply/demand zone rejections or candlestick formations.
Practical Example
On the USDJPY M30 chart, the RMO Indicator displayed blue dots below the histogram, signaling a bullish reversal. Price action confirmed this with a rebound from the demand zone, strengthening the buy entry setup. Similarly, red dots above the histogram can confirm bearish reversals for sell trades.
Best Practices
- Use RMO alongside price action and other indicators like MACD or RSI.
- Apply on higher timeframes to reduce false signals.
- Always manage risk with stop-loss and take-profit strategies.
Conclusion
The RMO Indicator for MT5 is a reliable trend-following tool that helps traders identify market direction and reversal zones. Its combination of moving averages and histogram bars makes it versatile for scalpers, day traders, and swing traders. Best of all, it’s free to download and easy to integrate into your trading strategy.
Published:
Apr 09, 2026 06:22 AM
Category: