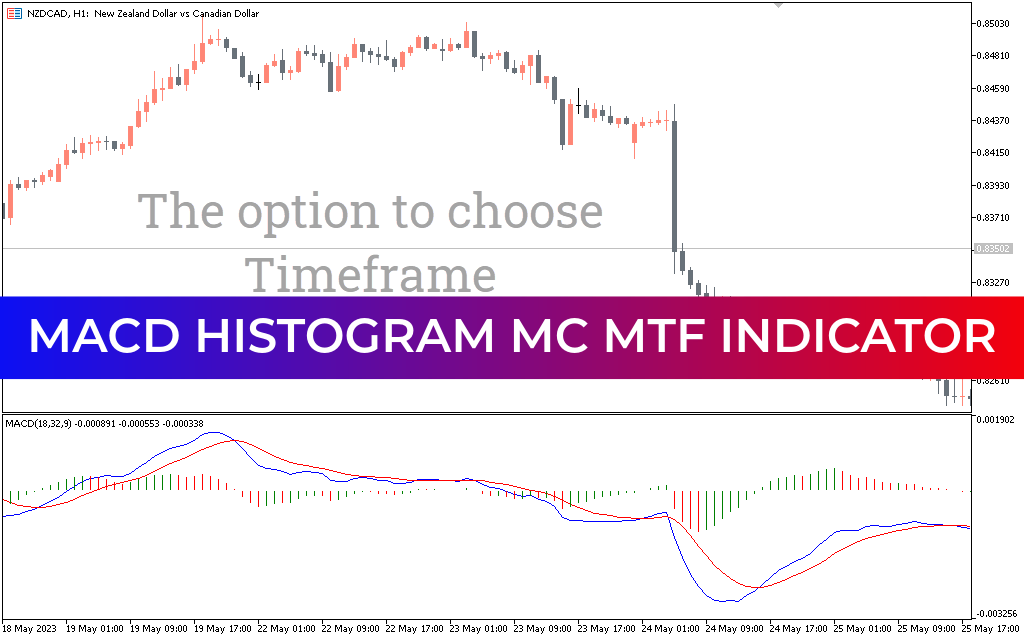
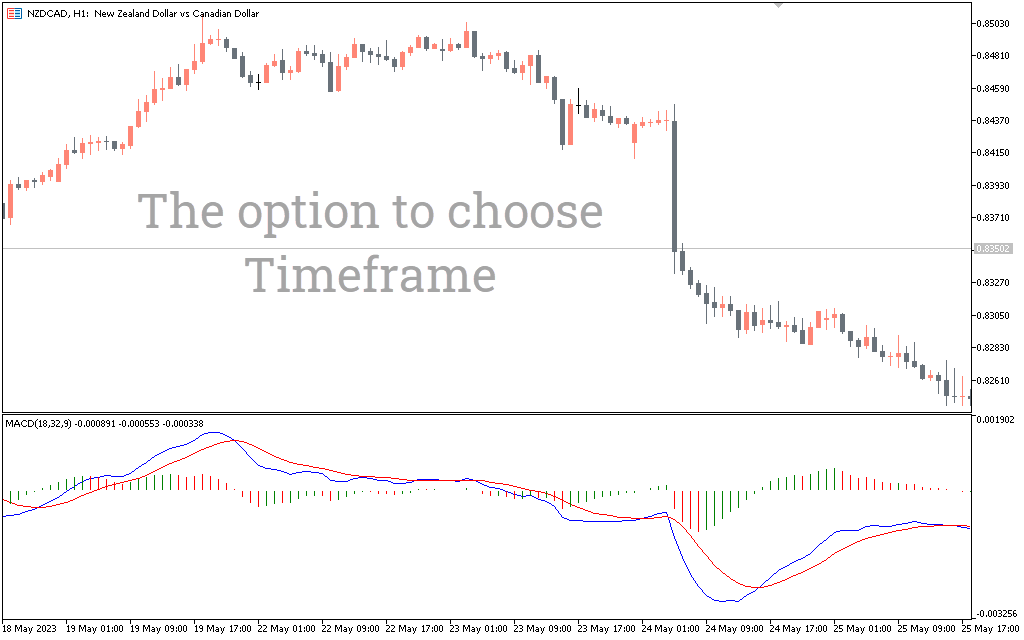
The MACD Histogram MC Mtf Indicator for MT5 is a powerful Forex trading tool that allows traders to analyze trend direction across multiple timeframes. By combining MACD data from the current chart and the next higher timeframe, it provides a clear visual representation of both short-term and long-term market trends.
Key Features
Multi-Timeframe MACD Display
- Shows MACD histogram, MACD line, and signal line for the current timeframe
- Overlays MACD data from the next higher timeframe in the same indicator window
- Enables traders to quickly assess trend alignment for more confident trade decisions
Trend Visualization
- Histogram bars indicate bullish or bearish momentum
- Crossings of the MACD line and signal line provide entry or exit signals
- Higher timeframe MACD line adds confirmation to lower timeframe trades
Suitable for All Traders
- Can be used for manual or automated trading strategies
- Works on any timeframe, though higher timeframes typically yield more reliable signals
- Useful for both trend-following and multi-timeframe analysis
How to Trade Using MACD Histogram MC MTF
Bullish Signals
- Lower timeframe MACD line (red) crosses above higher timeframe MACD line (blue)
- Confirm that the higher timeframe trend is also bullish
- Consider entering a buy trade
- Use the histogram and signal line crossing for precise entry timing
Bearish Signals
- Lower timeframe MACD line (red) crosses below higher timeframe MACD line (blue)
- Ensure the higher timeframe trend is bearish
- Enter a sell trade
- Use the zero-line crossing and histogram bars to confirm Trend Strength
Trend Alignment Strategy
- Only trade when lower and higher timeframe trends are aligned
- Avoid trades when the higher timeframe trend contradicts the lower timeframe signal
Conclusion
The MACD Histogram MC MTF Indicator for MT5 is an essential tool for Forex traders seeking multi-timeframe trend analysis. It combines lower and higher timeframe MACD signals in a single chart, providing clear visual cues for trend direction, momentum, and potential trade entries. This indicator is ideal for trend-following strategies, quick decision-making, and confirming alignment across timeframes.
FAQ
1 Download
Published:
Mar 07, 2026 11:52 AM
Category: