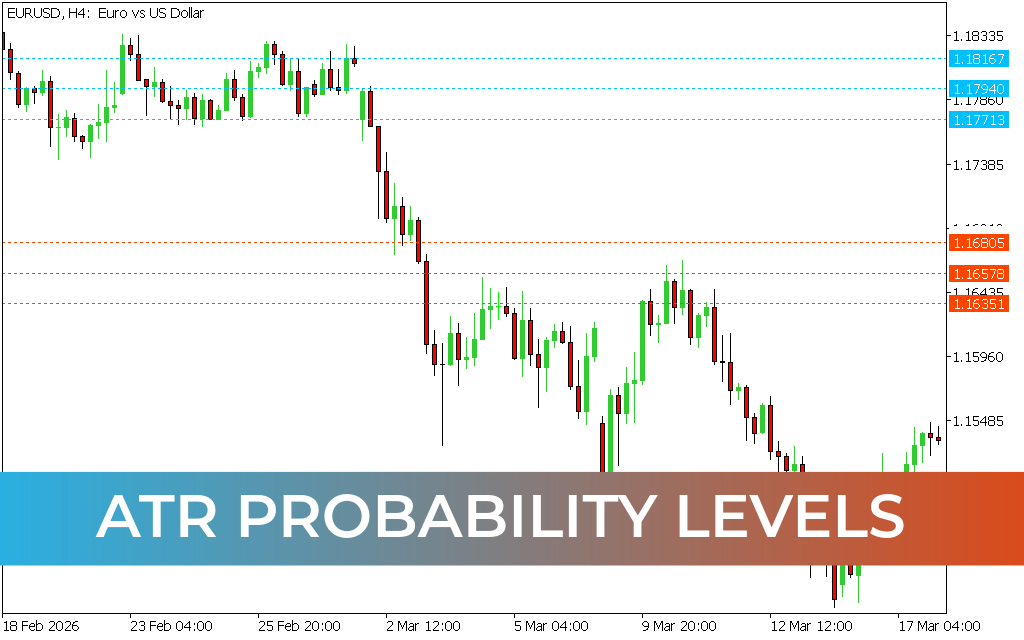
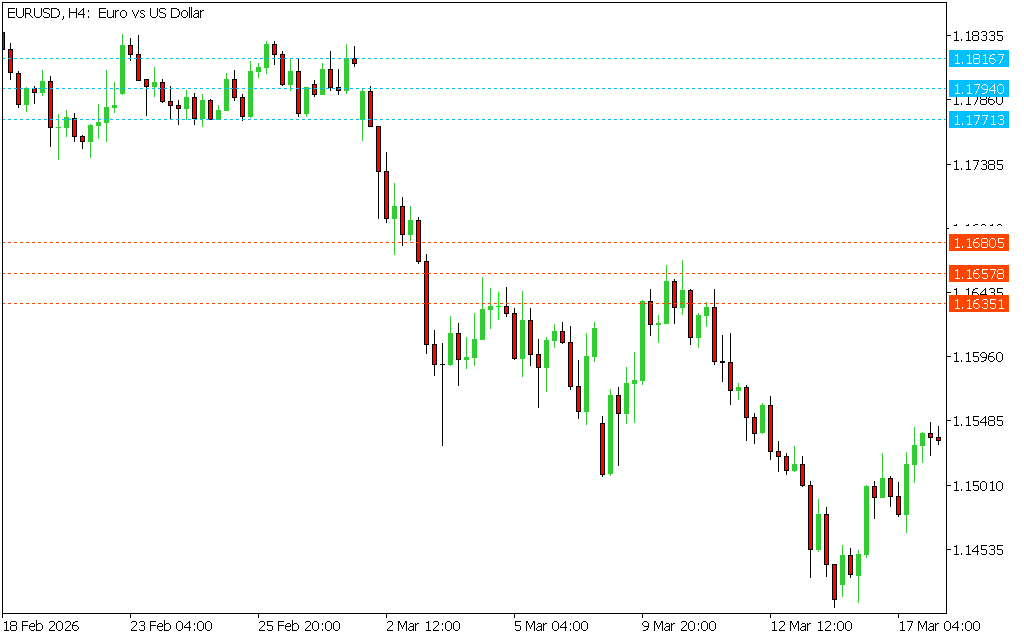
The ATR Probability Levels Indicator for MT5 is a volatility-based trading tool that uses Average True Range (ATR) to plot dynamic support and resistance levels. These levels help traders identify trend direction, breakout zones, and potential entry points with greater precision.
Unlike the traditional ATR, which is displayed as a line, this indicator transforms volatility data into actionable price levels, making it easier to interpret market behavior.
What is the ATR Probability Levels Indicator?
This indicator calculates price ranges based on market volatility and plots:
- Two resistance levels (ATR-based)
- Two support levels (ATR-based)
These levels act as probability zones where price is likely to react, reverse, or continue trending.
Key Features
- Plots dynamic support and resistance levels
- Based on ATR (volatility measurement)
- Helps identify trend direction and breakouts
- Works on all markets (forex, stocks, indices)
- Best suited for higher timeframes
- Can be combined with other indicators
How the Indicator Works
The indicator creates four key levels:
- Upper Resistance Levels (ATR zones) → Potential reversal or breakout zones
- Lower Support Levels (ATR zones) → Potential bounce or continuation zones
These levels adjust automatically based on market volatility, making them more adaptive than static support/resistance lines.
How to Trade with ATR Probability Levels
Buy Signal (Bullish Setup)
- Price approaches or bounces from support levels
- Market shows upward movement
- Confirm with momentum indicators like RSI
👉 Enter a BUY trade
Stop Loss: Below lower support level
Take Profit: Near resistance levels or based on risk-reward ratio
Sell Signal (Bearish Setup)
- Price reaches or breaks upper resistance levels
- Market shows downward pressure
- Confirm with indicators like MACD
👉 Enter a SELL trade
Stop Loss: Above resistance level
Take Profit: Near support levels
Trading Strategy Insights
- Breakout Strategy:
- Trade when price breaks strong ATR resistance/support levels
- Reversal Strategy:
- Look for price rejection at ATR levels
- Trend Confirmation:
- Use ATR levels with trend indicators for higher accuracy
Best Timeframes to Use
- Works on all timeframes
- Recommended: H1, H4, Daily for more reliable signals
- Lower timeframes may produce false signals due to noise
Why Use the ATR Probability Levels Indicator?
This indicator helps traders:
- Identify high-probability price zones
- Adapt to changing market volatility
- Improve entry and exit timing
- Combine volatility with Price Action
Limitations
- Less reliable on lower timeframes
- Requires confirmation from other indicators
- Not ideal as a standalone strategy
Conclusion
The ATR Probability Levels Indicator for MT5 is a valuable tool for traders who want to combine volatility analysis with support and resistance trading. By identifying key price zones, it allows traders to anticipate market moves and trade with higher confidence.
For best results, use it alongside indicators like RSI and MACD, along with proper risk management strategies.
3 Downloads
Published:
Apr 13, 2026 05:01 AM
Category: