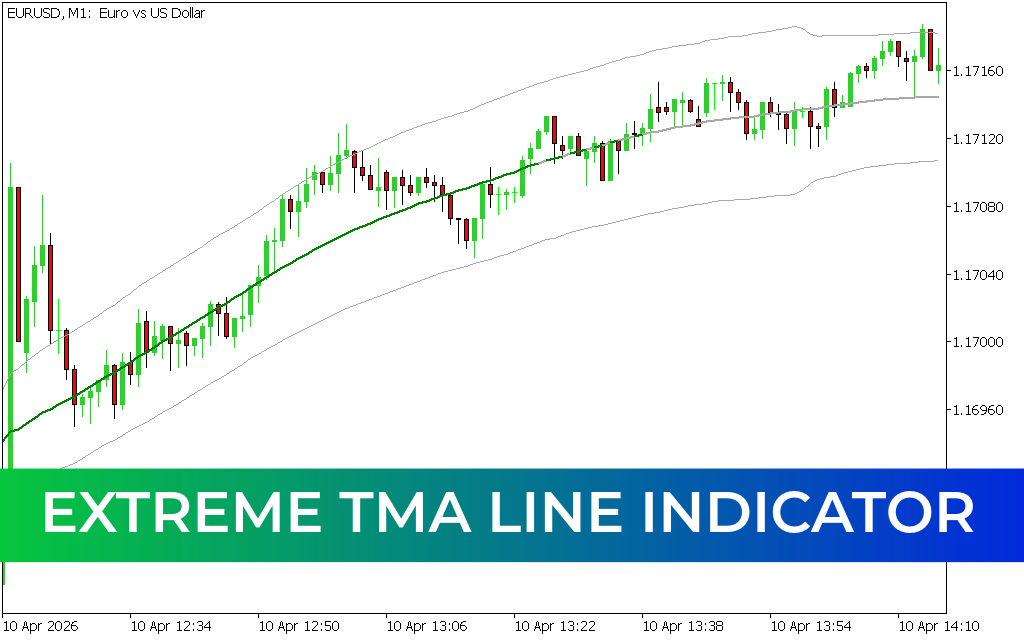
The Extreme TMA Line Indicator is a simple yet effective MT5 trading tool that helps traders identify trends and key price levels using dynamic bands. TMA stands for Triangular Moving Average, and this indicator visually resembles Bollinger Bands, featuring a central line and two outer bands.
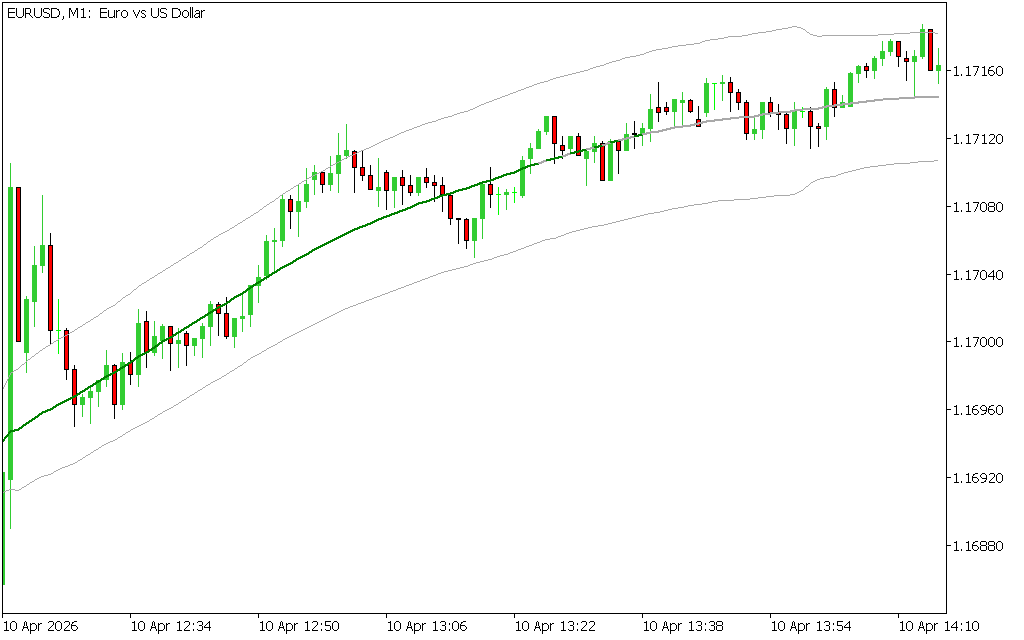
The upper and lower bands act as dynamic support and resistance levels, allowing traders to identify potential entry and exit points with greater accuracy.
How the Extreme TMA Line Indicator Works
The Extreme TMA Line Indicator uses both price and volume data to calculate its moving averages. It smooths out market noise to present a clearer view of Price Action through three main components:
- Upper Band – Acts as resistance
- Lower Band – Acts as support
- Center Line – Indicates trend direction
Color Signals of the Center Line:
- Green – Uptrend (bullish market)
- Red – Downtrend (bearish market)
- Yellow – Neutral market (no clear direction)
This color-coded system makes it easy for traders to quickly interpret market conditions.
Key Concept Behind TMA
The main purpose of the TMA indicator is to smooth price fluctuations so traders can focus on the broader trend. By reducing noise, it helps identify stronger and more reliable trading signals.
How to Trade with the Extreme TMA Line Indicator
The indicator is particularly useful for determining trend direction and timing entries based on the center line.
General Trading Rules:
- Trade in the direction of the center line color
- Avoid trading during yellow (neutral) conditions
- Use bands as support/resistance confirmation
Buy Strategy
Follow these steps for a long (buy) setup:
- The center line turns green
- Wait for the trend to stabilize (line fully formed)
- Enter a buy trade along the green line
- Place Stop Loss near the recent swing low
- Exit when the center line changes color
Sell Strategy
For a short (sell) setup:
- The center line turns red
- Wait for confirmation of the downtrend
- Enter a sell trade along the red line
- Place Stop Loss near the recent swing high
- Exit when the center line changes color
Customization and Optimization
The default TMA settings can be adjusted to suit your trading style:
- Short-term strategies (Scalping/intraday): Use a lower period (e.g., 10)
- Long-term trading: Use higher periods for smoother signals
To improve accuracy, combine the Extreme TMA Line Indicator with other tools such as:
- RSI (Relative Strength Index)
- MACD (Moving Average Convergence Divergence)
Final Thoughts
The Extreme TMA Line Indicator is a versatile and beginner-friendly tool that works across all timeframes. Its clear visual signals and dynamic support/resistance bands make it an excellent choice for identifying trends and trade opportunities.
For best results, always confirm signals using additional indicators and proper risk management techniques.
4 Downloads
Published:
Apr 14, 2026 06:39 AM
Category: