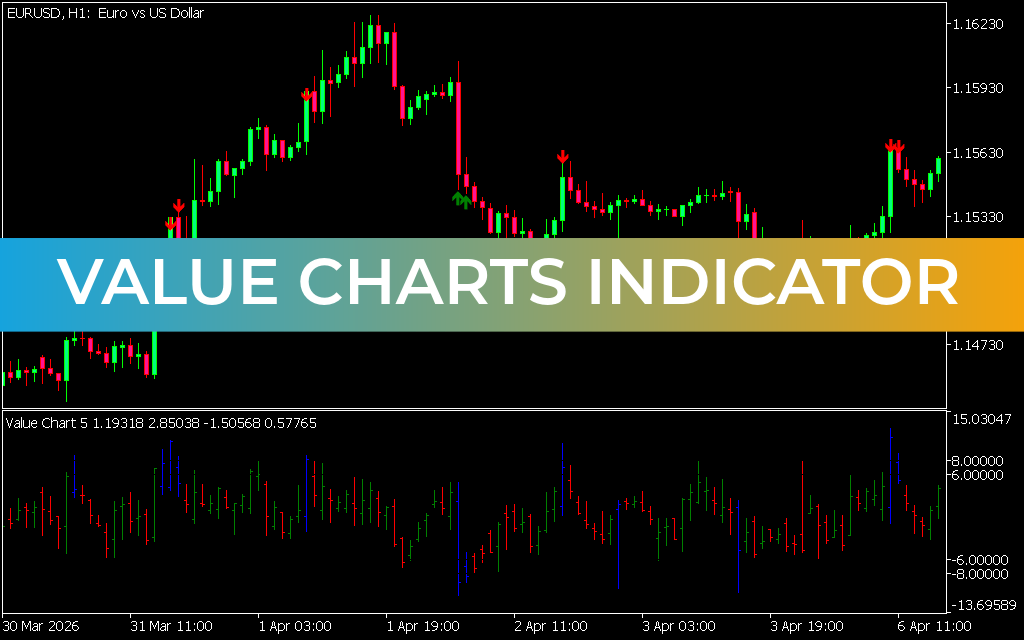
The Value Charts Indicator for MT5 is a powerful oscillator that displays price behavior in a unique way by plotting a separate chart with colored candles and key overbought/oversold levels. This helps traders quickly identify potential trend reversals and high-probability entry points.
By simplifying price extremes, the indicator allows traders to make more informed BUY and SELL decisions with better timing.
What is the Value Charts Indicator?
Unlike traditional indicators, the Value Charts Indicator creates a separate window with its own price representation:
- Green candles → Bullish movement
- Red candles → Bearish movement
- Upper level → Overbought zone
- Lower level → Oversold zone
These levels help traders anticipate when the market is stretched and likely to reverse.
Key Features
- Displays custom value-based price candles
- Identifies overbought and oversold conditions
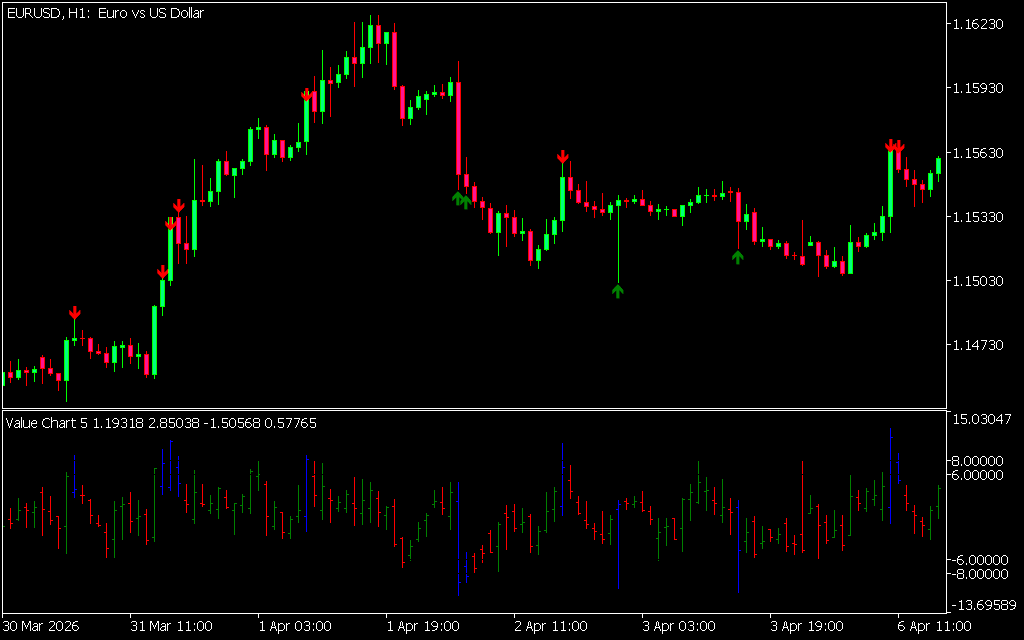
- Provides visual buy/sell arrow signals
- Works on all timeframes (intraday to long-term)
- Suitable for beginners and advanced traders
- Easy to install and use
How the Indicator Works
The indicator measures price deviation and plots it within a fixed range:
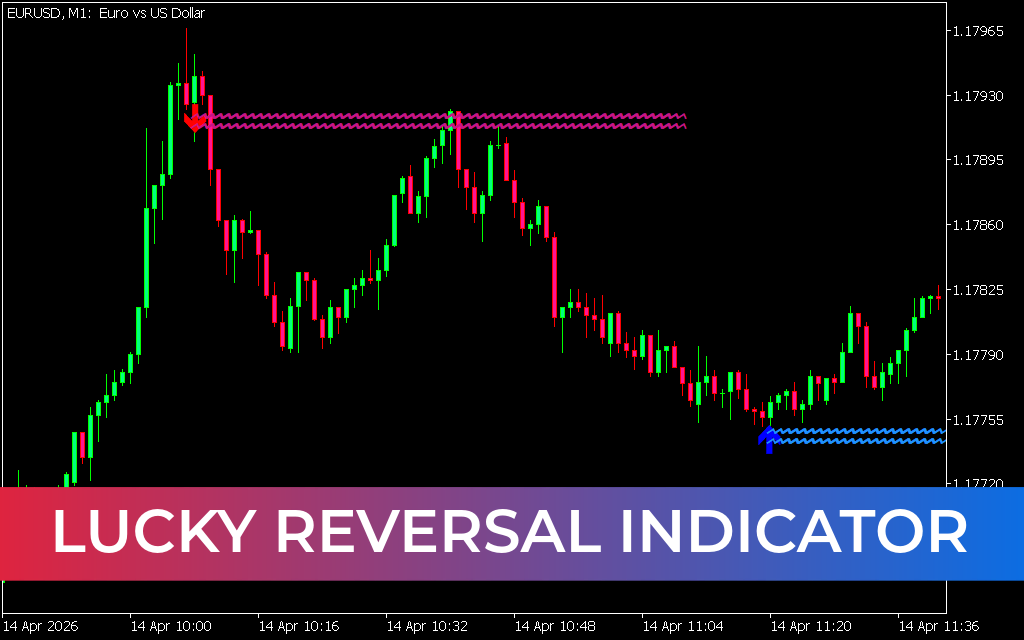
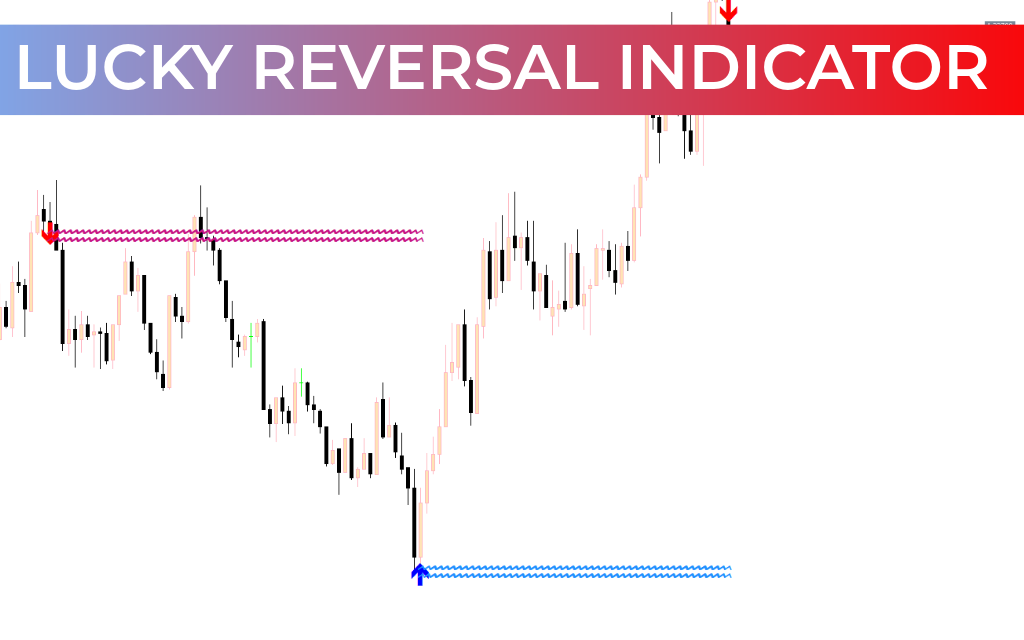
- When price reaches overbought levels → Potential bearish reversal
- When price reaches oversold levels → Potential bullish reversal
It also generates arrow signals on the main chart to highlight trade opportunities.
How to Trade with Value Charts Indicator
Buy Setup (Oversold Condition)
- Price reaches or crosses the oversold level
- Indicator shows bullish signals (green candles/arrows)
- Enter a BUY trade
Stop Loss: Below previous swing low
Take Profit: Based on resistance levels or risk-reward ratio
Sell Setup (Overbought Condition)
- Price reaches the overbought level
- Indicator shows bearish signals (red candles/arrows)
- Enter a SELL trade
Stop Loss: Above previous swing high
Take Profit: Based on support levels
Trading Tips for Better Results
- Always confirm signals using:
- Price Action (e.g., candlestick patterns)
- Support and resistance zones
- Trend indicators
- Avoid trading solely based on overbought/oversold levels
- Works best in ranging or mildly trending markets
Who Should Use This Indicator?
The Value Charts Indicator is ideal for:
- Beginners learning reversal trading
- Intraday traders seeking precise entries
- Swing traders identifying turning points
- Advanced traders building multi-indicator systems
Why Use the Value Charts Indicator?
This indicator helps traders:
- Identify market extremes easily
- Improve entry timing
- Spot potential reversals quickly
- Reduce emotional trading decisions
Conclusion
The Value Charts Indicator for MT5 is a valuable tool for identifying overbought and oversold conditions with clarity. While it provides strong reversal signals, it performs best when combined with price action and additional technical indicators.
Used correctly, it can significantly enhance your trading accuracy and consistency.
2 Downloads
Published:
Apr 12, 2026 11:56 AM
Category: