Support And Resistance levels are fundamental concepts in forex trading. They represent key price zones where the market often pauses, reverses, or accelerates. However, accurately placing these levels can be challenging, especially for new traders.
The Daily Pivot Points Indicator for MT4 solves this problem by calculating precise pivot, support, and resistance levels based on the previous trading session.
What Are Pivot Points?
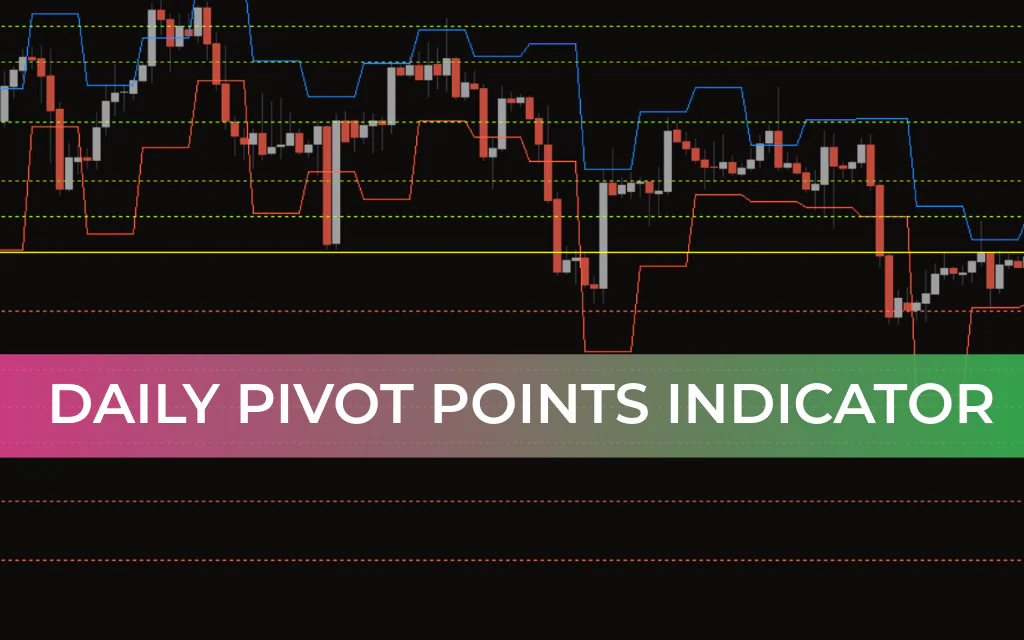
The Daily Pivot Points Indicator shows potential reversal and breakout levels on your chart.
Pivot Point (PP) – The main level that represents the market’s average price.
Resistance Levels (R1, R2, R3) – Potential price ceilings where the market may reverse downward.
Support Levels (S1, S2, S3) – Potential price floors where the market may reverse upward.
Intermediate or Midpoints – Levels between the pivot and support/resistance zones.
These levels are calculated objectively using the previous session’s high, low, and close prices, ensuring consistency for all traders.
How Daily Pivot Points Are Calculated
The formulas for calculating pivot points and their associated support/resistance levels are:
Pivot Point (PP):
PP=(High+Low+Close)3PP = \frac{(High + Low + Close)}{3}PP=3(High+Low+Close)
Resistance Levels:
R1 = (2 × PP) – Low
R2 = PP + (High – Low)
R3 = High + 2 × (PP – Low)
Support Levels:
S1 = (2 × PP) – High
S2 = PP – (High – Low)
S3 = Low – 2 × (High – PP)
How to Use the Daily Pivot Points Indicator
The Daily Pivot Points Indicator is versatile and works for both range-bound traders and breakout traders:
1️⃣ Range-Bound Trading
Buy near support – S1, S2, S3 can act as potential buying levels.
Sell near resistance – R1, R2, R3 can act as potential selling levels.
Combine with candlestick patterns for confirmation.
2️⃣ Breakout Trading
Bullish breakout – Price breaks R1, R2, or R3, signaling strong buying momentum.
Bearish breakout – Price breaks S1, S2, or S3, signaling strong selling pressure.
Place trades after the breakout to capture trend continuation.
3️⃣ Risk Management
Pivot, support, and resistance levels can be used as take-profit or stop-loss zones, enhancing risk control.
Advantages of the Daily Pivot Points Indicator
✅ Objective – Uses a standardized calculation method.
✅ Quick analysis – Shows all key levels at a glance.
✅ Versatile – Suitable for Scalping, intraday, and longer-term trading.
✅ Supports multiple strategies – Works for range-bound, breakout, or trend-following strategies.
✅ Widely used – Trusted by both retail traders and professional market makers.
❌ Considerations:
Best results are achieved in combination with other technical tools, like candlestick patterns or oscillators.
Pivot points are intraday levels, so longer-term trends should also be analyzed for context.
Conclusion
The Daily Pivot Points Indicator for MT4 is an essential tool for identifying support, resistance, and potential reversal points.
Helps traders place trades accurately.
Can be used for take-profit and stop-loss placement.
Works well in combination with candlestick patterns and other technical indicators.
By adding the Daily Pivot Points Indicator to your MT4 chart, traders gain clarity, objectivity, and confidence in their trading decisions.
FAQ
1 Download
Published:
Feb 20, 2026 10:41 AM
Category: