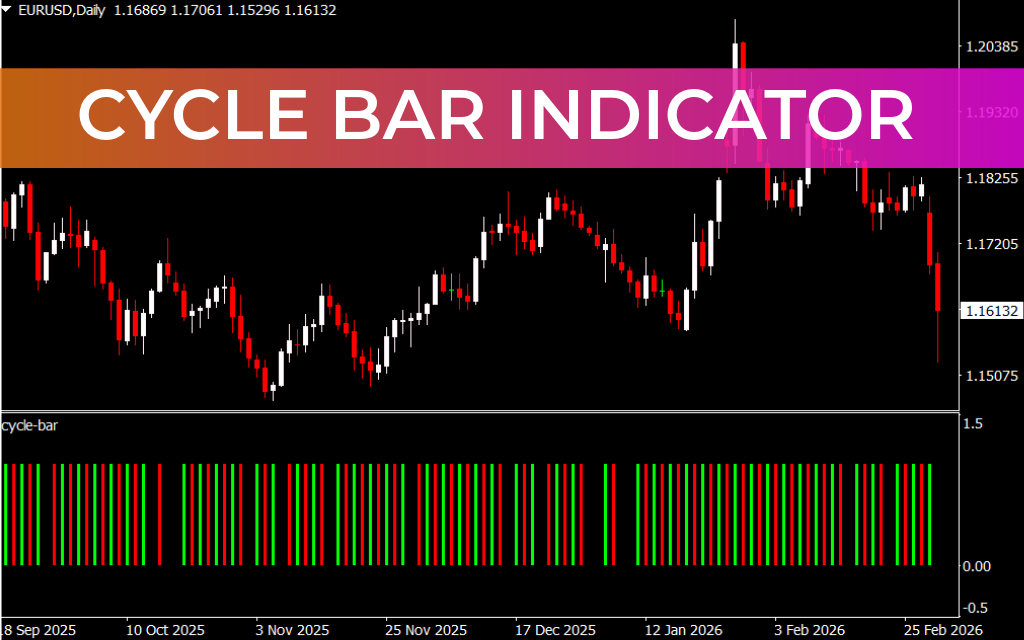
The Cycle Bar Indicator for MT4 is a momentum-based tool that plots colored bars in a separate window below the price chart. The indicator combines Simple Moving Average (SMA) and Relative Strength Index (RSI) calculations to determine the current market cycle and momentum direction.
- Green bars indicate bullish market conditions.
- Red bars indicate bearish market conditions.
These bars reflect the underlying candlestick behavior and help traders understand whether the market is currently in a bullish or bearish cycle.
The indicator performs best on higher timeframes, as shorter timeframes may produce gaps between bars due to market noise and consolidation.
Key Features of the Cycle Bar Indicator
- Based on SMA and RSI calculations
- Displays bullish and bearish cycle bars
- Easy-to-read red and green color coding
- Works on all timeframes
- Helps identify Trend Strength and market cycles
How to Use the Cycle Bar Indicator for MT4
The Cycle Bar Indicator does not generate direct BUY or SELL signals. Instead, it provides insight into the current candlestick cycle and overall market bias.
🔵 Bullish Cycle
If the market is showing bullish strength, the indicator plots green bars, suggesting upward momentum.
🔴 Bearish Cycle
If bearish pressure dominates, the indicator displays red bars, indicating downward momentum.
However, the bars may not always correspond exactly to the current candlestick’s color due to the internal SMA and RSI calculations. Therefore, it is recommended to use additional confirmation tools such as RSI, MACD, or Price Action analysis before entering trades.
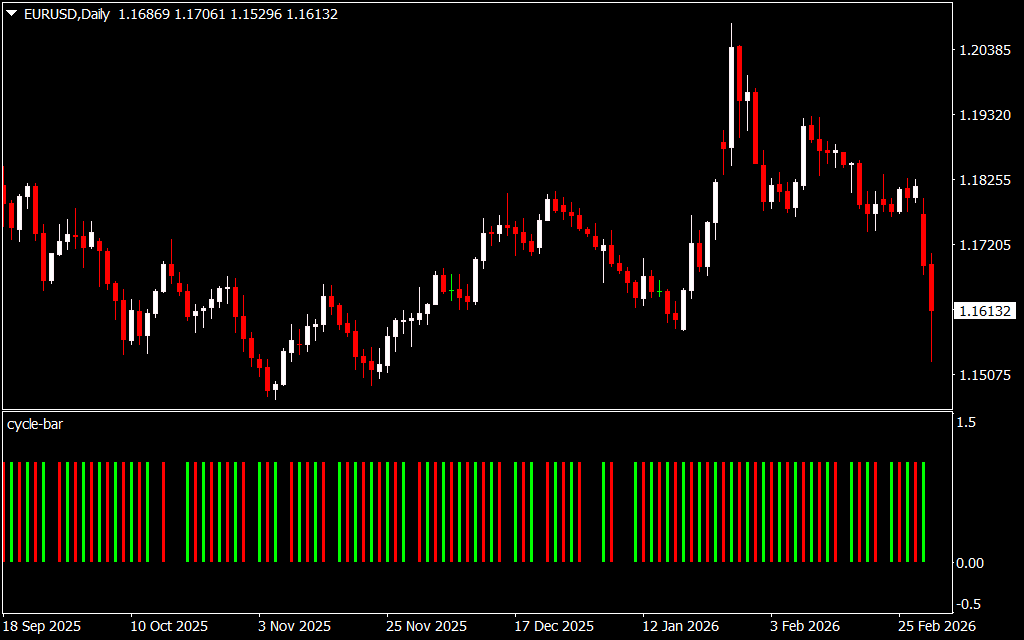
Consolidation Behavior
During periods of low volatility or consolidation, the indicator may leave empty spaces between bars. This typically signals weak momentum or an indecisive market. Traders should avoid taking trades during such conditions and wait for clear trend development.
Best Trading Practices
- Use on Daily, H4, or other higher timeframes for better reliability.
- Combine with trend-following indicators for confirmation.
- Avoid trading during consolidation phases.
- Use as a momentum filter rather than a standalone entry tool.
Conclusion
The Cycle Bar Indicator for MT4 uses SMA and RSI calculations to plot green and red bars that represent bullish and bearish market cycles. While it does not provide direct entry signals, it serves as a valuable momentum confirmation tool when combined with other technical indicators.
FAQ
Published:
Mar 03, 2026 16:17 PM
Category: