The Market Guru Indicator for MT4 is a custom trend-following tool designed to help traders identify the direction and momentum of the market. It displays clear histogram signals that represent bullish or bearish market conditions, making it easier to analyze trends and find trading opportunities.

One of the main advantages of this indicator is that its signals do not repaint, which increases reliability for traders who rely on accurate historical signals. Its chart-friendly design ensures that it does not clutter the trading screen while still providing clear insights into market sentiment.
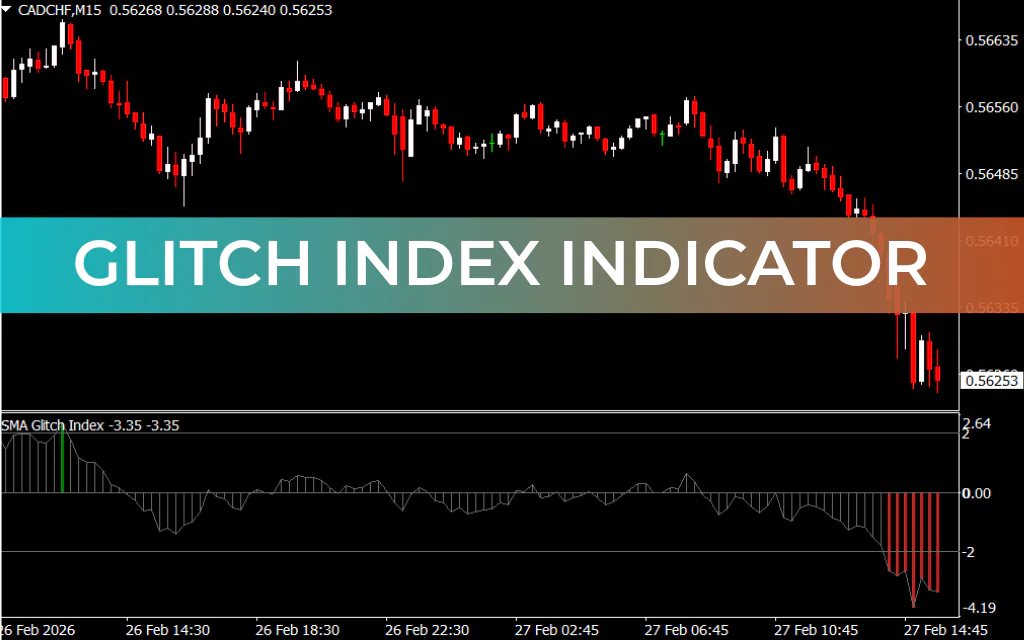
The Market Guru indicator analyzes price movements using advanced algorithms and displays histogram bars to represent the current trend:
- Dodger Blue Histogram Bars: Indicate bullish market momentum.
- Red Histogram Bars: Indicate bearish market momentum.
These histogram signals help traders quickly determine whether the market is trending upward or downward, allowing them to trade in the direction of the dominant trend.
The indicator supports multiple trading styles, including Scalping, intraday trading, and swing trading. However, higher timeframes such as H4, Daily, and Weekly charts tend to provide more reliable signals.
How to Trade With the Market Guru Indicator
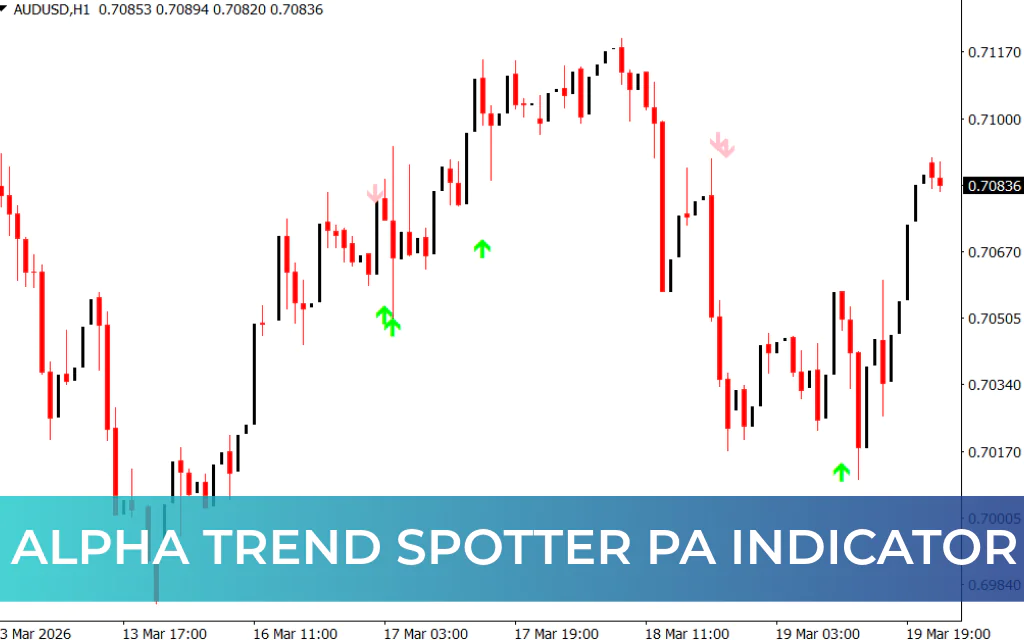
When applied to an MT4 chart, the Market Guru Indicator displays histogram bars below the price chart that reflect market sentiment and trend direction.
Although it can be used as a standalone indicator, combining it with Price Action or other technical indicators can improve trade accuracy.
Buy Signal
- Identify that the overall market trend is bullish.
- Wait for the indicator to display dodger blue histogram bars.
- Confirm the signal with bullish price action, such as a bullish engulfing candlestick pattern.
- Enter a buy (long) position.
The blue histogram bars indicate that bullish momentum is increasing.
Sell Signal
- Confirm that the market is in a bearish trend.
- Wait for the indicator to display red histogram bars.
- Look for confirmation from bearish price action, such as a bearish Engulfing Pattern.
- Enter a sell (short) position.
The red histogram bars signal increasing bearish momentum.
Stop Loss and Take Profit
Risk management should always be applied when using the Market Guru Indicator.
A common approach includes:
- Stop Loss: Place it below the recent swing low for buy trades or above the recent swing high for sell trades.
- Take Profit: Use a realistic risk-to-reward ratio, such as 1:2. For example, a 30-pip stop loss with a 60-pip take profit.
Traders do not necessarily need to wait for the opposite signal before closing a trade.
Why Use the Market Guru Indicator
The Market Guru Indicator provides several benefits:
- Clear trend identification using histogram bars
- Non-repainting signals for reliable analysis
- Useful for momentum trading strategies
- Works with multiple trading styles and timeframes
- Simple and beginner-friendly interface
Conclusion
The Market Guru Indicator for MT4 is a reliable technical analysis tool for identifying market trends and momentum. Its non-repainting histogram signals help traders determine whether the market is bullish or bearish, making it easier to align trades with the prevailing trend.
For best results, traders should use the indicator in trending markets and combine it with price action or other technical indicators. The Market Guru Indicator is also free to download and simple to install on the MetaTrader 4 platform.
FAQ
1 Download
Published:
Mar 10, 2026 16:19 PM
Category: