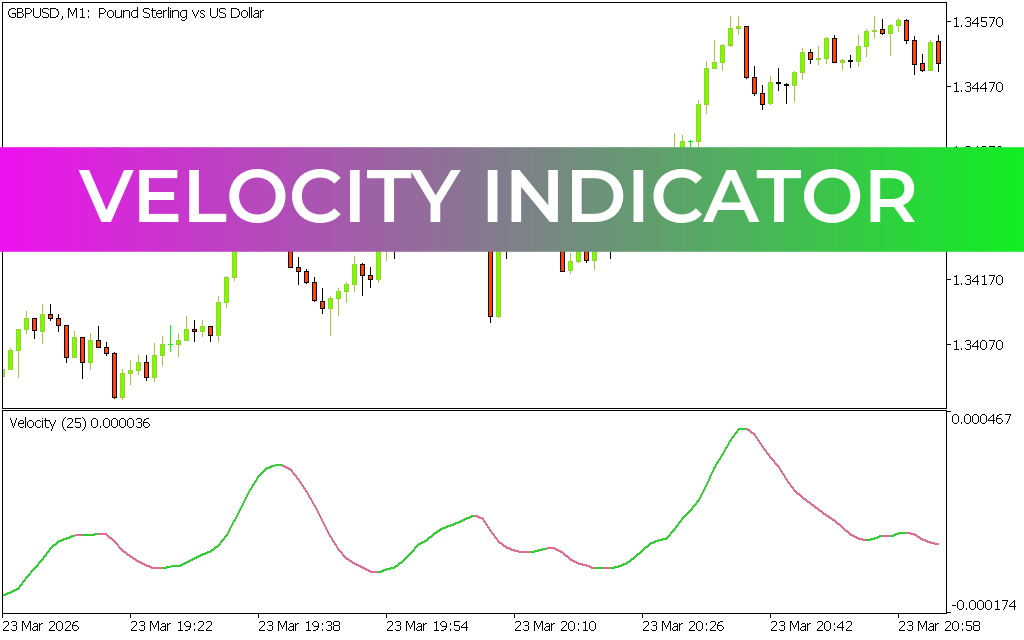
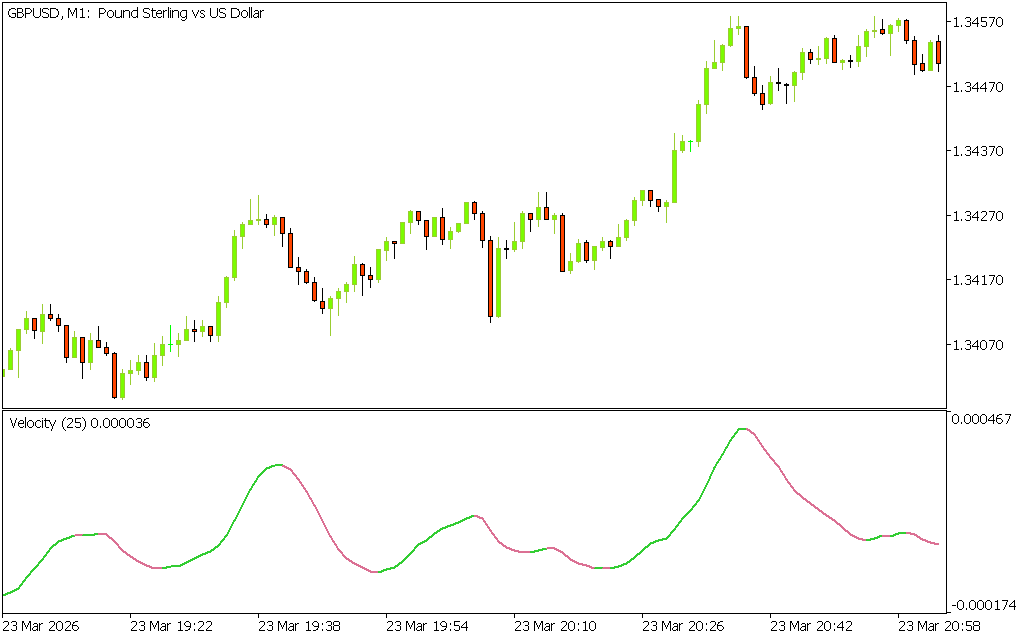
The Velocity Indicator for MetaTrader 5 (MT5) measures the average rate at which the price of a financial instrument increases or decreases over a specified period. While it works on a principle similar to momentum and volatility indicators, it focuses specifically on the speed of price movement rather than its strength. This makes it a valuable tool for traders who want to understand how quickly the market is moving in a bullish or bearish direction.
Key Features
- Histogram Display: Shows bullish and bearish velocity above or below the zero line.
- Market Speed Measurement: Indicates how fast or slow price moves in a given direction.
- Multi-Timeframe Utility: Works across intraday, daily, weekly, and monthly charts.
- Visual Signals: Green histogram bars suggest bullish velocity, while pink bars suggest bearish velocity.
How to Use the Velocity Indicator
- Bullish Velocity: When histogram bars rise above the zero line in green, it indicates upward speed in price movement.
- Bearish Velocity: When histogram bars fall below the zero line in pink, it signals downward speed.
- Bar Length Interpretation: Longer histogram bars indicate slower price movement, while shorter bars suggest faster price movement.
- Confirmation Strategy: Since the indicator does not generate direct buy/sell signals, traders should confirm entries with Price Action or other technical tools.
Benefits
- Provides a unique perspective on market speed.
- Helps traders anticipate potential bullish or bearish moves.
- Suitable for scalpers, day traders, and long-term traders.
- Enhances decision-making when combined with momentum or volatility indicators.
Conclusion
The Velocity Indicator for MT5 is a powerful tool for analyzing the speed of price movements. By highlighting bullish and bearish velocity, it helps traders refine their strategies and make more informed trading decisions. Best of all, it can be downloaded for free.
7 Downloads
Published:
Apr 05, 2026 03:07 AM
Category: