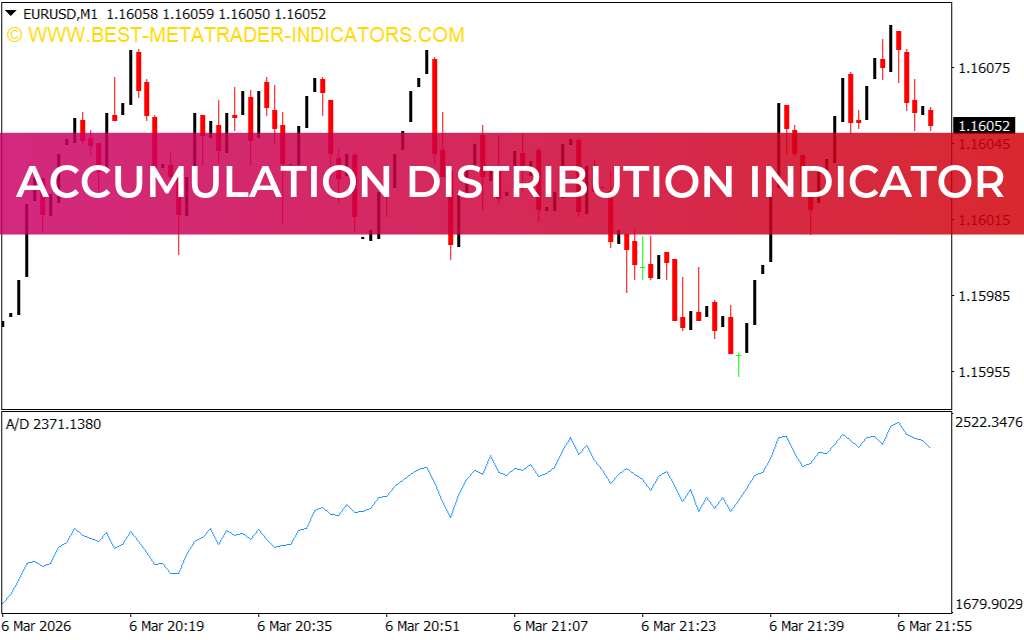
The Accumulation Distribution Indicator for MetaTrader 4 (MT4) is a powerful volume-based Trend Indicator used by forex and stock traders to analyze market momentum and Trend Strength. It helps determine whether an asset is being accumulated (bought) or distributed (sold) by market participants.
By evaluating the relationship between price movement and trading volume, the indicator provides valuable insight into whether the current trend is strong enough to continue or likely to reverse. Because of its clear signals and straightforward interpretation, the Accumulation Distribution indicator is suitable for both beginner and experienced traders.
What Is the Accumulation Distribution Indicator?
The Accumulation Distribution (A/D) indicator measures money flow into and out of an asset. It tracks how volume supports price movements to reveal the true strength behind a trend.
The indicator helps traders understand two important market conditions:
Accumulation
Accumulation occurs when traders are actively buying an asset, causing price and buying pressure to increase.
Distribution
Distribution occurs when traders are selling their holdings, which often results in declining prices and bearish pressure.
By monitoring these conditions, traders can anticipate trend continuation or potential reversals.
How the Accumulation Distribution Indicator Works
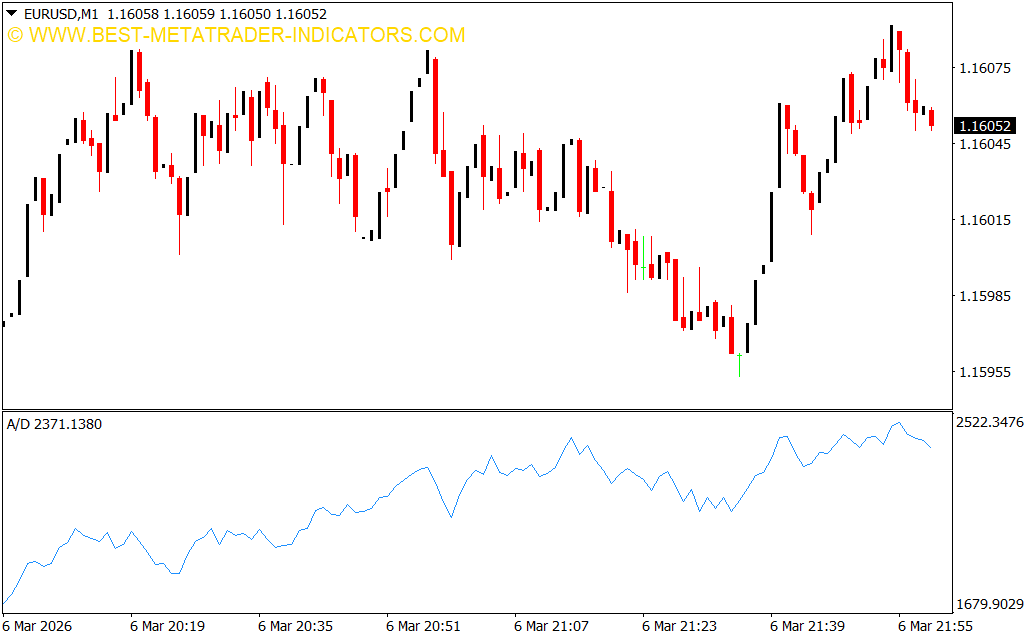
The A/D indicator calculates the flow of volume relative to price movement. When buying pressure increases, the indicator line moves upward, signaling strong accumulation. When selling pressure dominates, the line moves downward, indicating distribution.
Key signals include:
- Rising A/D line – Strong buying pressure and potential bullish trend
- Falling A/D line – Strong selling pressure and potential bearish trend
- Divergence with price – Possible Trend Reversal
This makes the indicator particularly useful for detecting hidden market momentum.
How to Trade With the Accumulation Distribution Indicator
The Accumulation Distribution indicator is commonly used to confirm trend strength and breakout opportunities.
Buy Trade Setup
- Price approaches a key resistance level.
- The market breaks above resistance.
- The Accumulation Distribution line rises above its previous high.
- Traders may enter a buy trade after the breakout confirmation.
This indicates that buying pressure is supporting the bullish breakout.
Sell Trade Setup
- Price approaches a support level.
- The market breaks below support.
- The Accumulation Distribution line falls sharply.
- Traders may open a sell position after confirmation.
This suggests that selling pressure is strengthening the bearish trend.
Combining Accumulation Distribution With Other Indicators
Although the Accumulation Distribution indicator is powerful on its own, it works even better when combined with other technical tools such as:
- MACD
- RSI
- Trend-following indicators
- Support And Resistance analysis
Using multiple indicators helps traders confirm signals and reduce false entries.
Conclusion
The Accumulation Distribution Indicator for MT4 is one of the most effective tools for analyzing market momentum and trend strength through price and volume analysis. By identifying accumulation and distribution phases, traders can better understand whether buyers or sellers are controlling the market.
With its simple interpretation and powerful insights, the indicator is useful for beginners, intermediate traders, and market professionals alike. Best of all, it is free to download and easy to install on the MetaTrader 4 platform.
FAQ
1 Download
Published:
Mar 08, 2026 06:58 AM
Category: