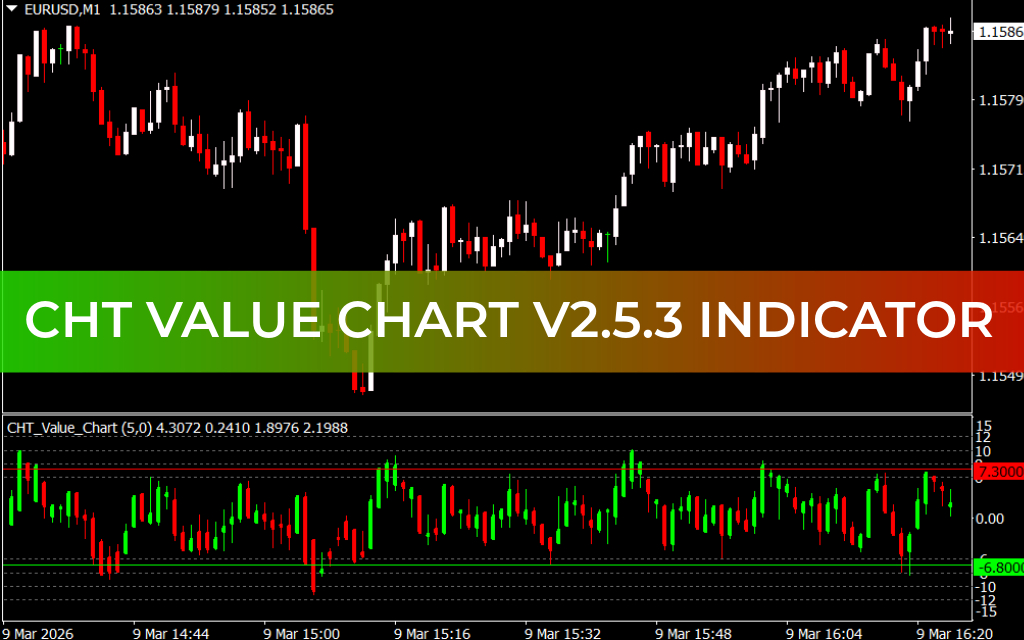
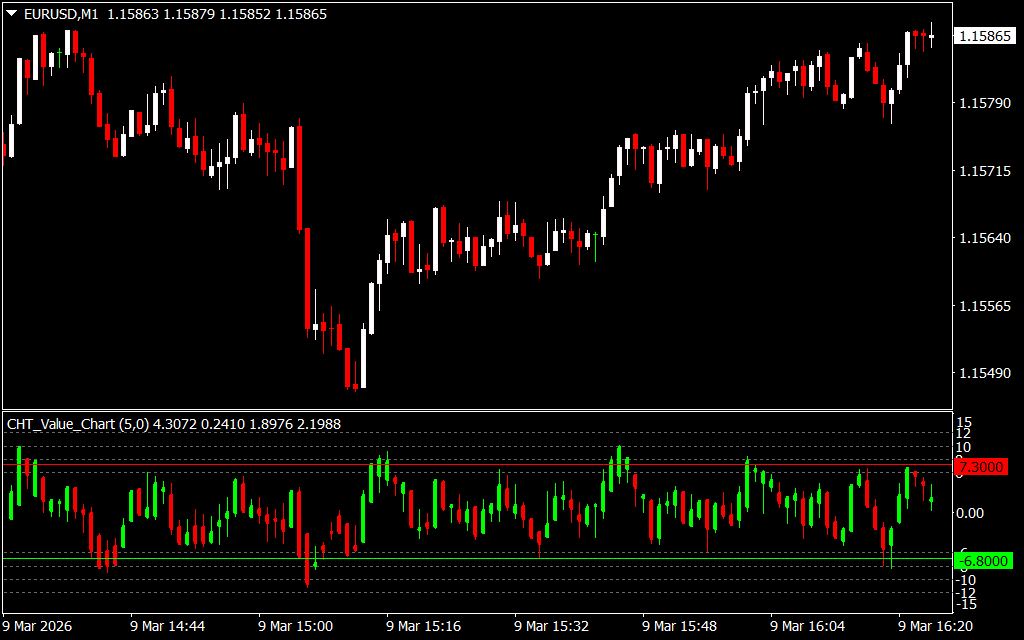
The CHT Value Chart V2.5.3 indicator for MT4 is a powerful oscillator that helps forex traders identify potential trend reversals by plotting an additional value chart in a separate indicator window. With clear overbought and oversold levels, this tool provides actionable buy and sell signals to improve trading accuracy.
How the CHT Value Chart Works
The indicator plots green and red candles to represent bullish and bearish conditions and highlights key overbought (green line) and oversold (red line) levels. When the indicator reaches these levels, traders can anticipate potential market reversals:
- Buy Signal: Candles touch the oversold red line, suggesting a bullish reversal. Enter trades with a stop loss below the previous swing low.
- Sell Signal: Candles touch the overbought green line, indicating a bearish reversal. Place stop loss above the previous swing high.
The CHT Value Chart does not provide profit targets, so traders should use a suitable risk-reward ratio or exit based on opposite signals.
Key Features
- Overbought & Oversold Levels: Anticipates potential trend reversals.
- Visual Candle Signals: Green for bullish and red for bearish market conditions.
- Multi-Timeframe Compatibility: Works on intraday, daily, weekly, and monthly charts.
- Beginner & Advanced Friendly: Beginners can use oversold/overbought signals with Price Action, while advanced traders can combine it with other indicators.
- Part of a Trading Strategy: Best used with price action or additional indicators for confirmation.
- Free & Easy to Install: Available for download at no cost.
How to Trade Using the CHT Value Chart
- Identify Reversal Points: Watch the value chart for candles touching overbought or oversold levels.
- Confirm Signals: Use price action or other indicators to validate the entry.
- Enter Trades: Buy or sell based on the signal with appropriate stop-loss placement.
- Manage Exits: Use risk-reward ratios or wait for opposite signals to close positions.
Why Traders Prefer CHT Value Chart
The CHT Value Chart V2.5.3 is effective because it provides clear visual cues for potential reversals while remaining simple to use. Its compatibility with multiple timeframes and flexibility to combine with other technical tools makes it a reliable part of any trading strategy.
Conclusion
The CHT Value Chart V2.5.3 indicator for MT4 is a versatile oscillator that plots overbought and oversold levels, helping traders anticipate market reversals. While it works well on its own, combining it with price action or other indicators yields the best results. Download the indicator for free and enhance your trading strategy today.
FAQ
12 Downloads
Published:
Mar 09, 2026 11:26 AM
Category: