The Chart Projection Indicator for MT4 is an advanced forecasting tool that helps traders anticipate future market trends and potential reversal points. It analyzes previous price movements and projects possible future Price Action directly on the chart, making it easier to identify buy and sell opportunities.
This indicator answers two critical questions every trader asks:
- What trend will likely occur next – bullish or bearish?
- When might the current trend end?
By projecting possible price paths, the indicator helps traders plan entries, exits, and risk management more effectively.
How the Chart Projection Indicator Works
The indicator combines two main components:
1. ZigZag Price Analysis
The classic ZigZag indicator breaks the price chart into bullish and bearish waves, highlighting significant market swings.
- Green ZigZag Line – Represents previous price action.
- Orange ZigZag Line – Represents projected future price movement.
2. Optical Algorithms
Special optical algorithms analyze the ZigZag waves to detect Points of Interest (POIs). These points help estimate where the market may move next and identify likely Support And Resistance zones.
The indicator provides several algorithm modes, including:
- Simple
- Flexible Specific
- Longscope Simple
- Longscope Flexible
- Complex
- S+R
- Original
These variations allow traders to experiment with different projection models.
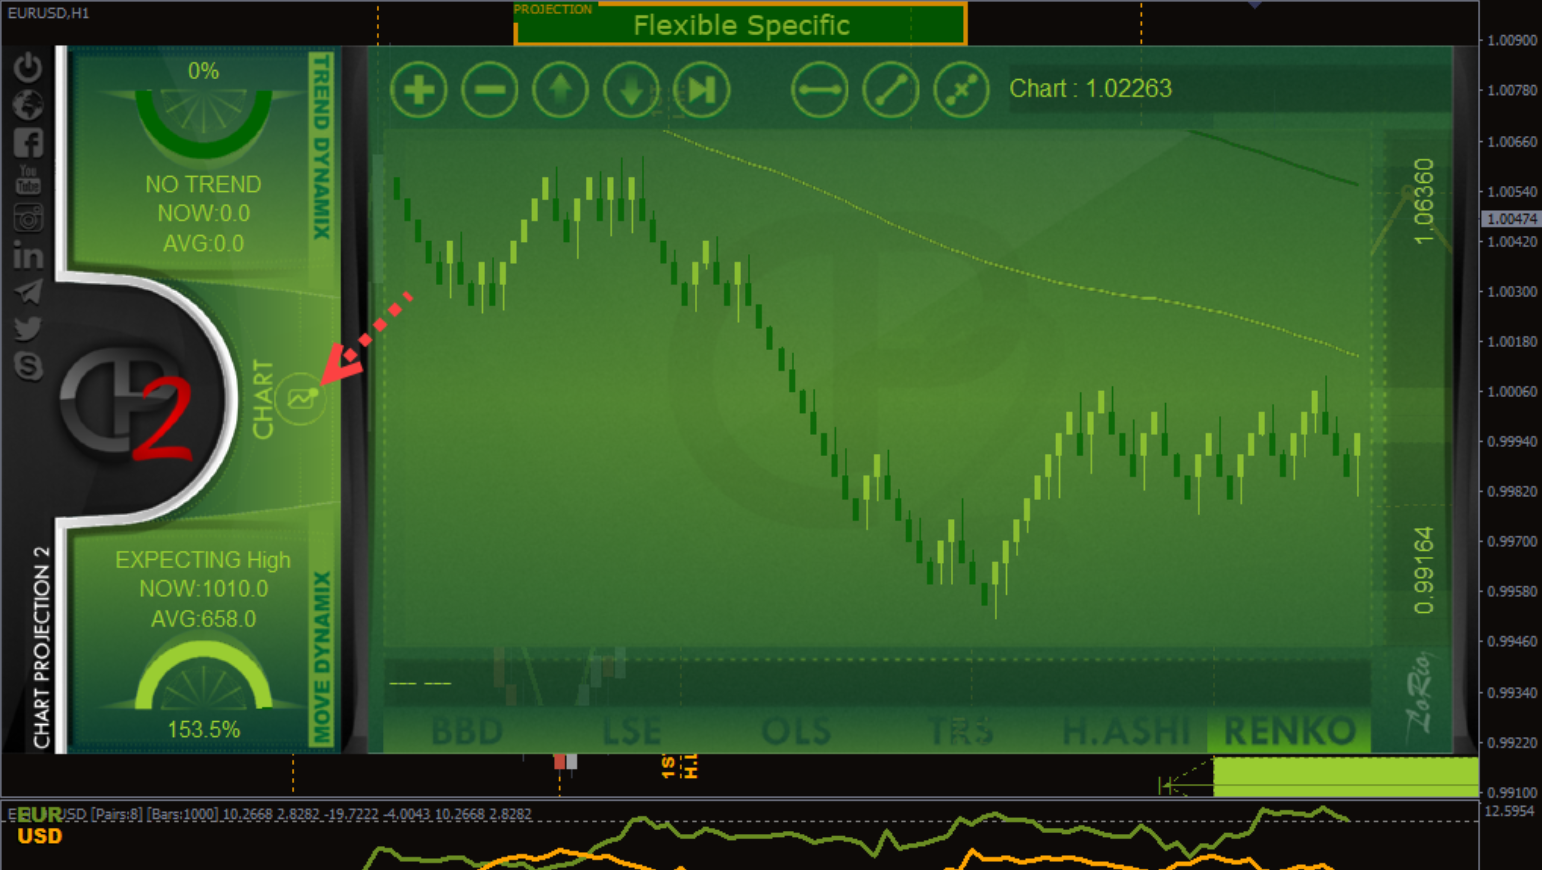
Visual Elements on the Chart
When applied to a chart, the indicator displays:
- Green ZigZag line – Historical price movement
- Orange ZigZag line – Predicted price path
- Green rectangles – Expected support and resistance zones
These visual cues help traders quickly understand the market outlook.
How to Trade With the Chart Projection Indicator
Buy Setup
- Wait for price to approach the lower point of the orange ZigZag projection.
- Enter a buy trade when price reacts at this level.
- Place stop loss below the projected support zone.
- Set take profit near the upper projected ZigZag point.
- Maintain a risk-reward ratio of at least 1:2.
Sell Setup
- Wait for price to reach the upper projected ZigZag point.
- Open a sell trade when price begins to reverse.
- Place stop loss above the resistance zone.
- Set take profit near the lower projected ZigZag level.
Additional Features
- Automatic support and resistance detection
- Ability to create Renko and Heiken Ashi charts
- Trend Strength analysis
- Currency strength calculation
- Works on any timeframe or forex pair
Advantages
- Provides visual projections of potential price movements
- Simplifies trend analysis for beginners
- Helps identify profit targets and risk levels
- Can assist with trend strength and currency analysis
Limitations
- The projection may change as new price data forms.
- Backtesting can be difficult because projections update dynamically.
Conclusion
The Chart Projection Indicator for MT4 is a unique forecasting tool that combines ZigZag wave analysis with optical algorithms to project possible future price movements. It can help traders identify trend direction, potential reversal zones, and profit targets with minimal manual analysis.
Although it cannot perfectly predict the future, it can be a useful tool for beginners and experienced traders alike when combined with proper risk management and market analysis.
FAQ
6 Downloads
Published:
Mar 08, 2026 17:41 PM
Category: