The Coppock Curve Indicator is a classic long-term oscillator developed by economist Edwin “Sedge” Coppock in 1965 by request of the Episcopal Church. Originally designed for long-term stock market investments, it identifies opportunities to open long positions on daily charts.
Despite its long-term origins, the Coppock Curve can also be applied to intraday charts, including hourly, for traders seeking trend signals on shorter timeframes.
What is the Coppock Curve Indicator?
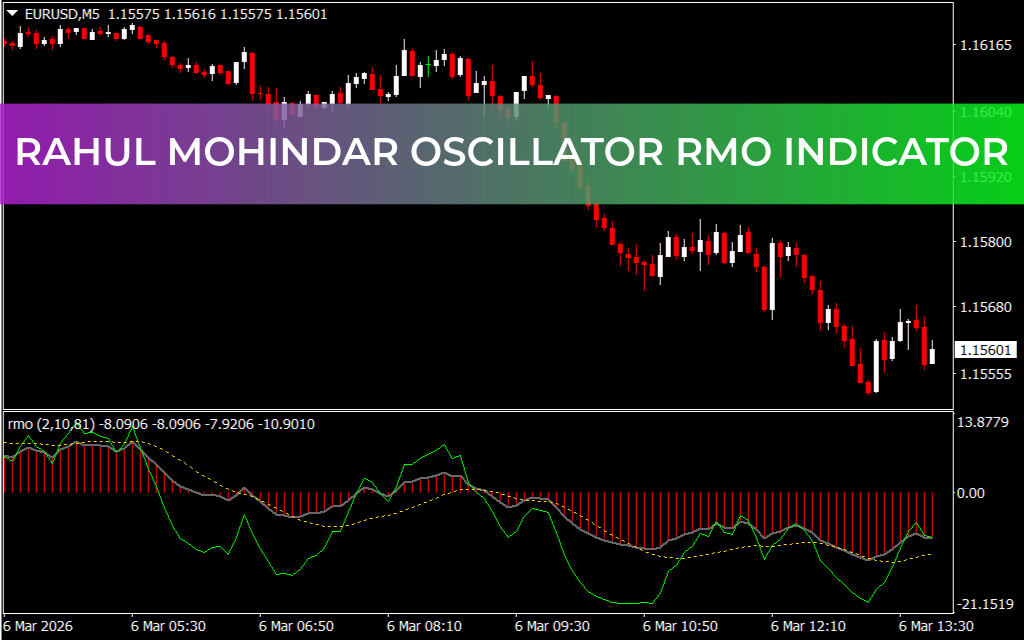
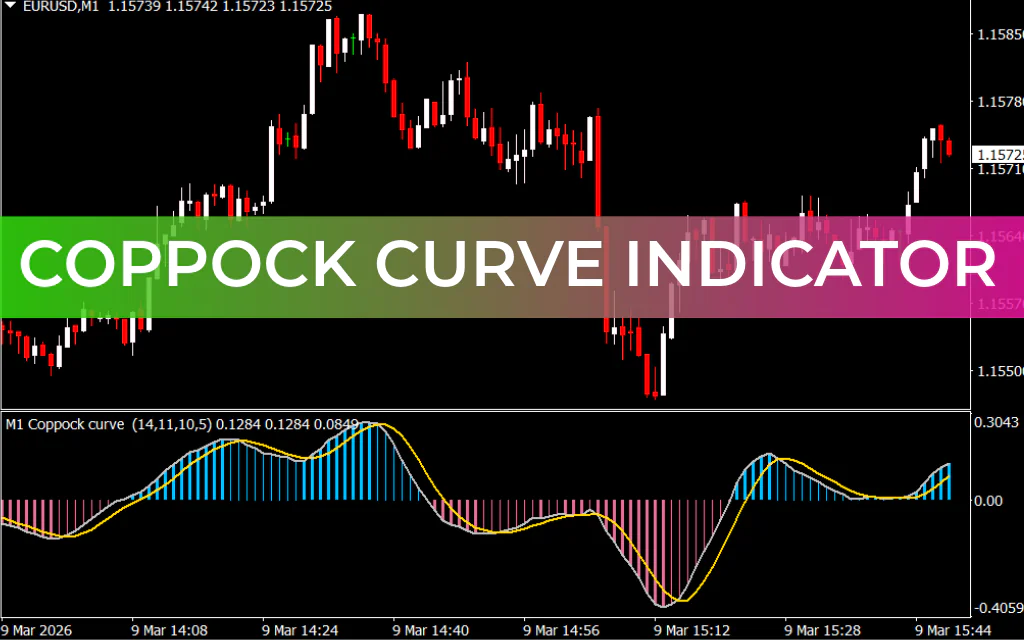
The Coppock Curve is a smoothed Momentum Indicator based on the Rate of Change (ROC). Key features of the MT4/MT5 version include:
- Gray Main Curve – Represents the original Coppock calculation
- Gold Smoothed Moving Average – Smooths the curve for clarity and easier interpretation
- Two-Color Histogram Bars – Quickly shows if the curve is rising or falling and whether it is above or below zero
This combination makes it a visual and functional tool for identifying long-term trends and potential trade entries.
How to Trade with the Coppock Curve
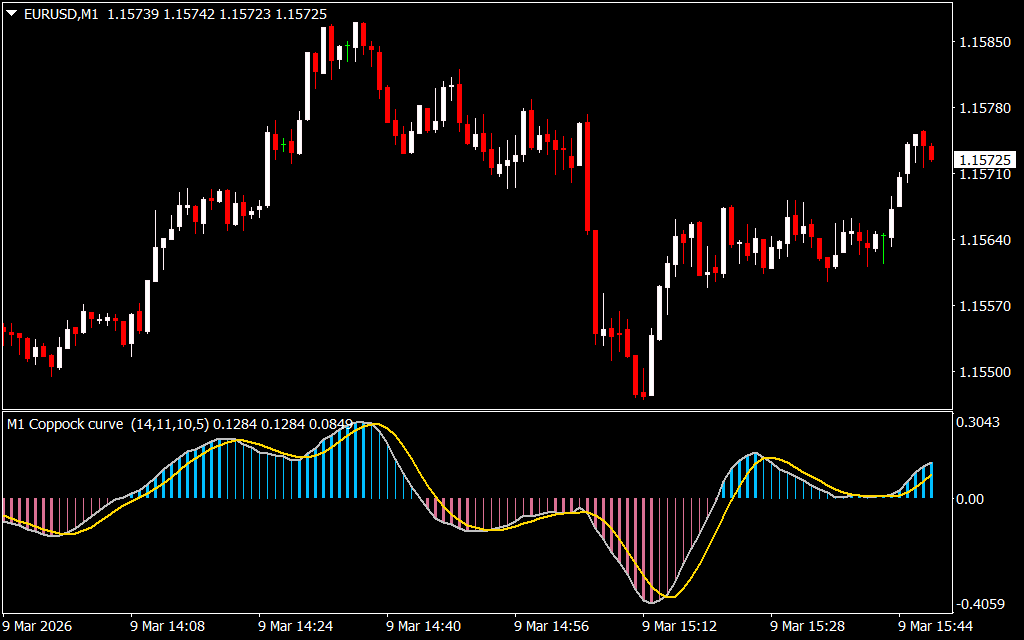
The indicator generates signals based on curve movement and zero-level crossings:
Classic Buy Signal
- Occurs when the Coppock Curve crosses the zero line from bottom to top
- Signals a potential long position, ideal for holding positions over a longer period
- Works best for stock markets, but can be adapted for forex or other markets
Additional Signals
- Zero line crossing from top to bottom → Potential short position
- Curve crossing its smoothed moving average → Trend Confirmation or early entry signal
By combining these signals, traders can enter long or short positions with a clear trend-following strategy.
Trading Example
On a USD/JPY H4 chart:
- The Coppock Curve rises from below zero, signaling a long trade entry.
- The gold smoothed moving average confirms the trend direction.
- The histogram bars provide a quick visual confirmation of bullish momentum.
Using these signals, traders can align with long-term trends while also observing intraday opportunities.
Advantages of the Coppock Curve Indicator
- Designed for long-term trend identification
- Works on daily, intraday, or multiple timeframes
- Smoothed moving average reduces noise and false signals
- Two-color histogram for quick visual interpretation
- Ideal for stocks, forex, and other assets
- Can be combined with other indicators for trade confirmation
This makes the Coppock Curve a versatile tool for trend-following strategies.
Conclusion
The Coppock Curve Indicator for MT4 is a classic momentum oscillator for identifying long-term bullish trends. By following zero-line crossings and moving average interactions, traders can confidently open long or short positions, adapting the indicator to both stock and forex markets.
Download Coppock Curve Indicator for MT4 for Free Now!
FAQ
3 Downloads
Published:
Mar 09, 2026 10:50 AM
Category: