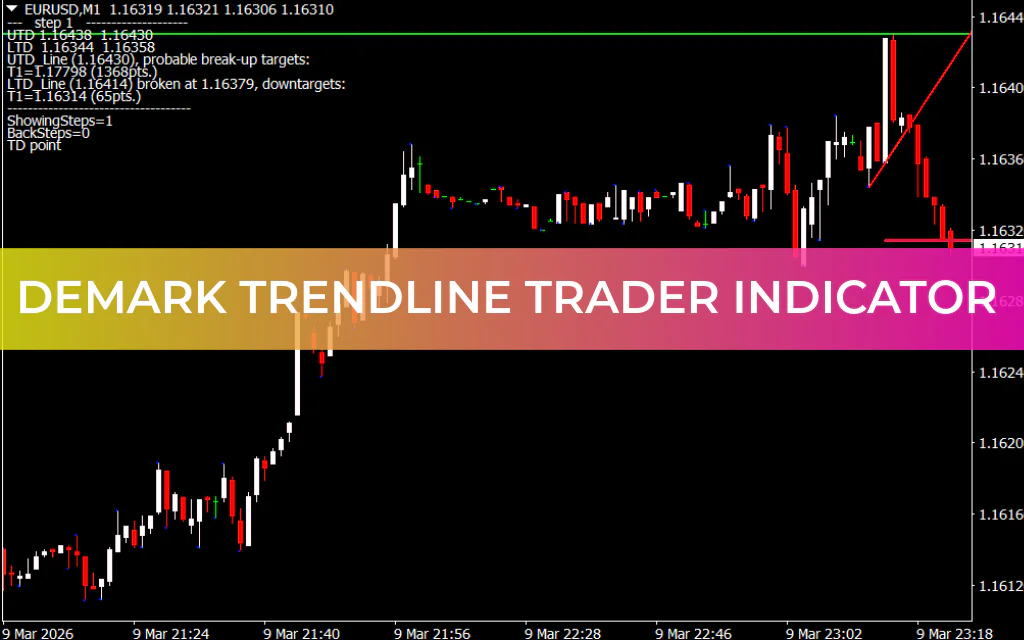
The DeMark Trendline Trader Indicator for MT4 is a technical analysis tool designed to help traders identify trend direction, Support And Resistance levels, and potential breakout opportunities. The indicator automatically draws diagonal and horizontal trendlines on the chart, making it easier for traders to analyze Market Structure and plan trades.
By highlighting key support and resistance zones, the indicator provides valuable insights into where price may reverse or break out, helping traders make more informed trading decisions.
What Is the DeMark Trendline Trader Indicator?
The DeMark Trendline Trader Indicator plots four key lines on the chart to help determine the trend and possible breakout levels:
Diagonal Trendlines
These lines represent dynamic support and resistance levels based on market structure.
- Red Line (HL1) – Indicates a support trendline
- Lime Green Line (LL1) – Indicates a resistance trendline
These diagonal lines help traders identify the direction of the current trend and possible breakout points.
Horizontal Support and Resistance Lines
The indicator also plots two horizontal levels that mark important price zones.
- Green Line (HC1) – Represents a resistance level
- Crimson Red Line (LC1) – Represents a support level
These horizontal lines act as upper and lower boundaries where the price may react or reverse.
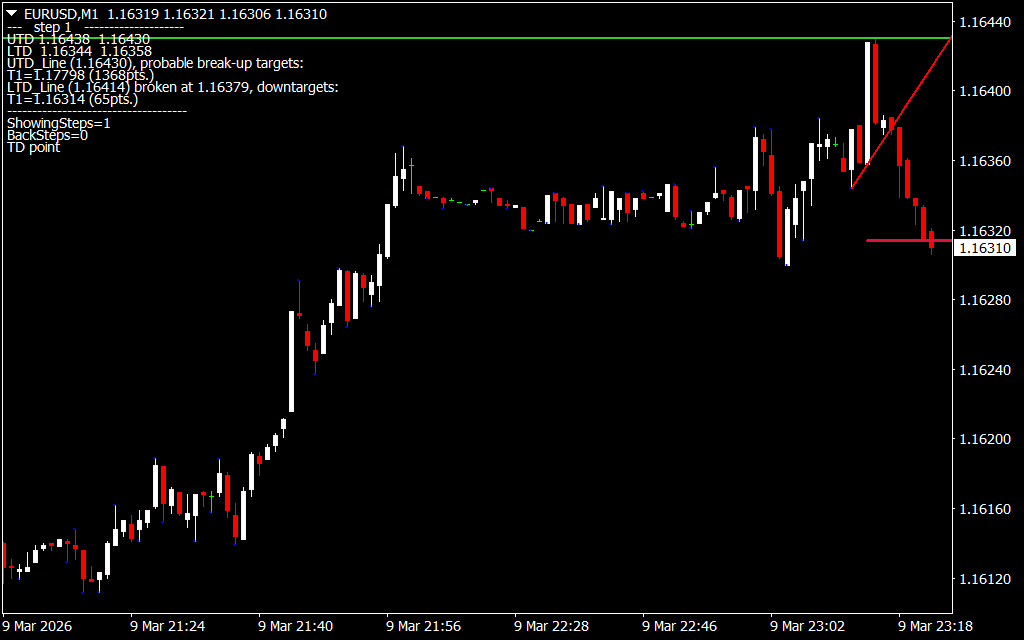
Additional Indicator Features
Besides drawing trendlines, the DeMark Trendline Trader Indicator includes several helpful features:
- Displays price level information in the upper-left corner of the chart
- Shows potential breakout targets
- Plots dots above candlesticks to highlight important Price Action areas
These features help traders quickly understand key trading levels and potential market moves.
Best Timeframes for This Indicator
The DeMark Trendline Trader Indicator works best on higher timeframes, such as:
- H1
- H4
- Daily charts
Using the indicator on very short timeframes may produce false signals, so longer timeframes are generally recommended for better accuracy.
DeMark Trendline Trader Indicator BUY Signal
To identify a BUY opportunity, follow these steps:
- Look for the red diagonal trendline (HL1) appearing on the chart.
- This line represents a support level.
- When the price reacts from this support area, traders may consider opening a BUY/LONG trade.
- Additional confirmation from price action or other indicators can improve accuracy.
DeMark Trendline Trader Indicator SELL Signal
To identify a SELL opportunity, follow these steps:
- Look for the lime green diagonal trendline (LL1).
- This line represents a resistance level.
- If the price reacts or rejects this level, traders may open a SELL/SHORT position.
The horizontal lines can also act as key areas where traders should watch for potential price reactions or breakouts.
Using the Indicator with Other Tools
For improved signal accuracy, traders often combine the DeMark Trendline Trader Indicator with other technical indicators such as:
- RSI (Relative Strength Index)
- MACD
- Moving Averages
- Price Action Analysis
Using multiple confirmations can help reduce false signals and increase the probability of successful trades.
Conclusion
The DeMark Trendline Trader Indicator for MT4 is a useful tool for identifying trend direction, support and resistance levels, and potential breakout targets. By automatically plotting diagonal and horizontal trendlines, the indicator simplifies market analysis and helps traders locate high-probability trade setups.
It is especially effective on higher timeframes, making it a valuable addition to the trading toolkit of both beginner and experienced forex traders.
You can download the DeMark Trendline Trader Indicator for MT4 for free and start using it to improve your technical analysis and trading strategy.
FAQ
Published:
Mar 09, 2026 18:24 PM
Category: