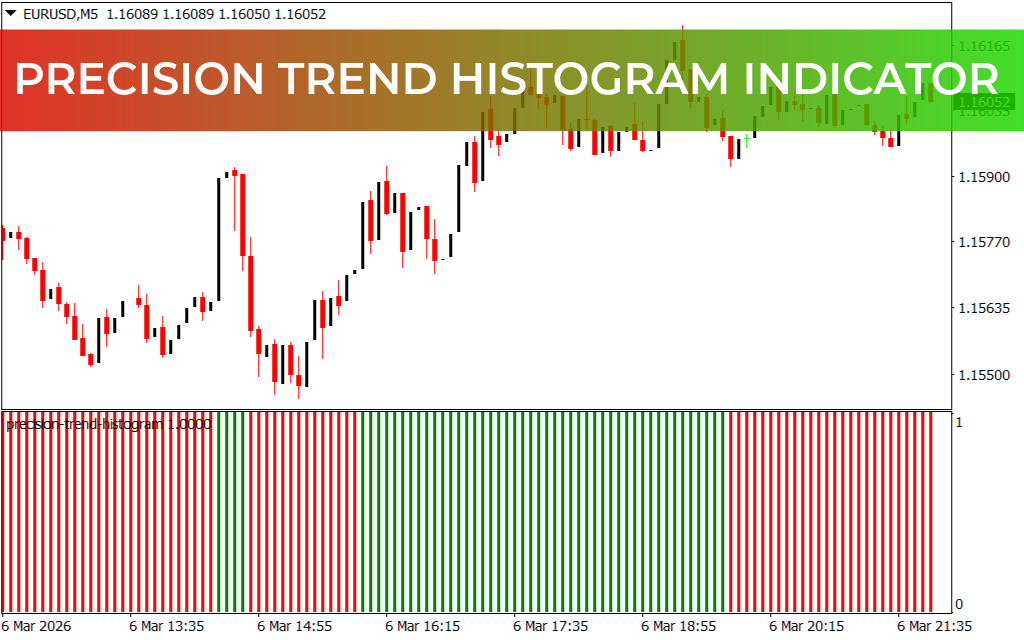
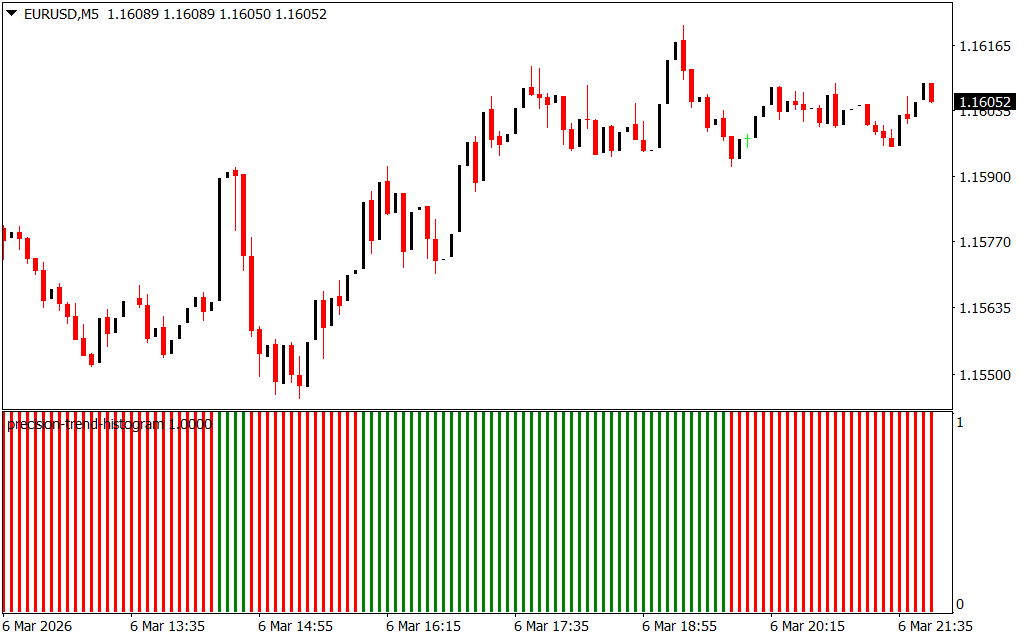
The Precision Trend Histogram is a powerful yet simple MT4 Trend Indicator designed to help traders easily identify the current market direction. It displays a histogram in a separate window below the chart, using color-coded bars to show whether the market is trending upward or downward.
This indicator is particularly useful for traders who prefer visual Trend Confirmation without cluttering their charts with complex indicators.
Key Features of Precision Trend Histogram
1. Color-Coded Trend Bars
- Green Bars → Indicate a bullish trend (buy opportunity).
- Red Bars → Indicate a bearish trend (sell opportunity).
The color of the histogram bars allows traders to quickly understand market momentum and trend direction.
2. Works on All Timeframes
The indicator can be applied to any timeframe, including M5, M15, H1, and H4.
However, many traders prefer using it on higher timeframes because they produce more reliable trend signals and reduce market noise.
3. Clear Trend Visualization
By plotting the histogram in a separate window, the indicator keeps the main price chart clean while still providing clear trading signals.
Precision Trend Histogram BUY and SELL Signals
To trade using the Precision Trend Histogram, traders only need to monitor the color of the histogram bars.
Buy Signal
- When the indicator starts plotting green bars, it suggests the market is entering an uptrend.
- Traders can consider opening long positions.
Sell Signal
- When the indicator begins displaying red bars, it indicates a downtrend.
- Traders may look for short-selling opportunities.
Identifying Trend Reversals
The indicator can also help traders identify potential market reversals.
- When the histogram changes from green to red, it may signal the end of an uptrend.
- When the histogram changes from red to green, it may indicate the start of a bullish trend.
However, the indicator may occasionally lag during volatile conditions. Because of this, traders should confirm reversals using price action, Support And Resistance levels, or additional indicators.
Trading Tips
- Use the indicator on H1, H4, or Daily charts for stronger signals.
- Combine it with moving averages or momentum indicators for better confirmation.
- Always monitor Price Action before entering or exiting trades.
Conclusion
The Precision Trend Histogram for MT4 is an effective trend-following tool that helps traders quickly identify bullish and bearish market conditions. With its simple red and green histogram bars, traders can easily spot trend direction and potential reversal points.
It is suitable for beginner and professional traders alike, and it can be downloaded for free from our website.
FAQ
2 Downloads
Published:
Mar 07, 2026 07:59 AM
Category: