Free
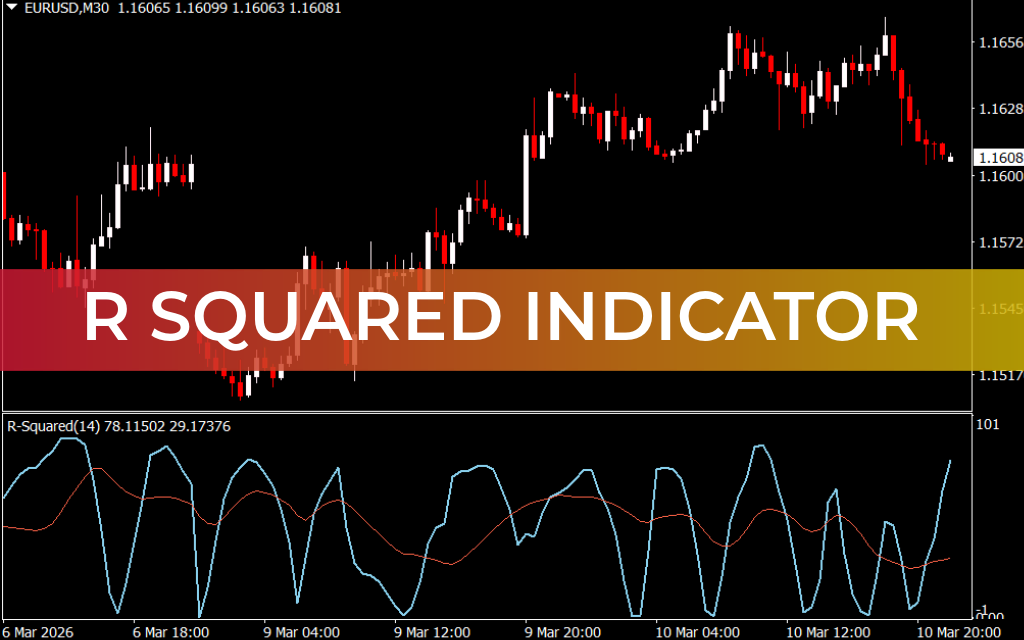
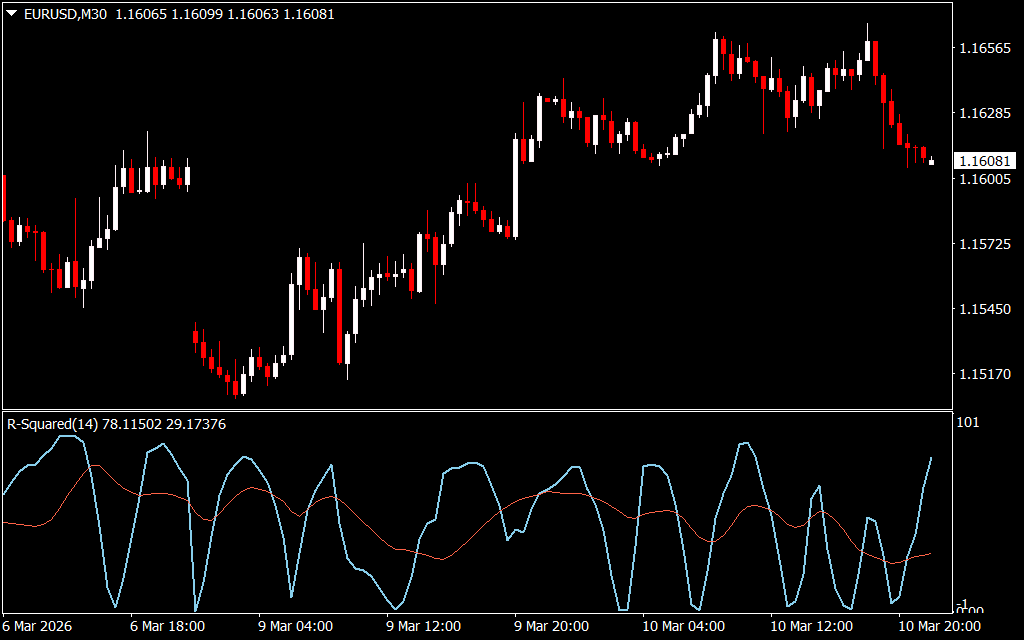
The R Squared Indicator is a momentum oscillator for MT4 that helps traders identify overbought and oversold market conditions. It belongs to the same family as the RSI and Stochastic Oscillators, making it a reliable tool for timing entries and exits.
Key Features
- Oscillation Range: 0 to 101
- Signal Lines:
- Length Line – reflects the current momentum.
- Smooth Line – provides a smoothed trend signal for clarity.
- Timeframe Flexibility: Can be applied on any timeframe, but performs best on longer-term charts (H4, Daily, Weekly).
- Momentum Focused: Helps identify when the market is overbought or oversold.
How to Trade With R Squared Indicator
Buy Signal (Long Entry)
- Wait for the signal line to approach 0, indicating oversold conditions.
- Consider entering a BUY/long position or exiting a short position.
- Optional: Confirm the signal using additional indicators like MA or RSI to avoid false signals.
Sell Signal (Short Entry)
- Wait for the signal line to approach 101, indicating overbought conditions.
- Consider entering a SELL/short position or exiting a long position.
- Optional: Combine with other technical indicators to improve accuracy.
⚠️ Note: The R Squared Indicator can give false signals in strongly trending markets, so it’s best used in combination with trend filters or other oscillators.
Advantages
- Simple and easy to understand for both beginners and advanced traders.
- Identifies high-probability entry and exit zones based on momentum extremes.
- Works well across multiple timeframes and trading instruments.
- Free to download and lightweight for MT4 platforms.
Conclusion
The R Squared Indicator is a practical tool for momentum-based trading. By monitoring overbought and oversold levels, traders can make informed buy and sell decisions. Pairing it with other indicators like MA or RSI enhances reliability.
FAQ
0 to 101 with smoothed vs raw signal lines for momentum clarity.
Values near the bottom of the range frame deeply oversold energy; the playbook looks for a possible exhaustion bounce, ideally backed by a moving average or RSI confirmation rather than blind knife-catching.
The upper end of the range marks stretched, overbought-style conditions where taking profit on longs or scouting shorts becomes more sensible if price and pattern agree.
Like RSI and Stochastic relatives, the line can hug extremes while trends grind; a separate trend filter helps you avoid fading a parabolic move without cause.
H4, daily, and weekly charts are called out as environments where the oscillator extremes tend to be steadier than on very fast intraday bars.
1 Download
Published:
Mar 10, 2026 17:27 PM
Category:
Share: