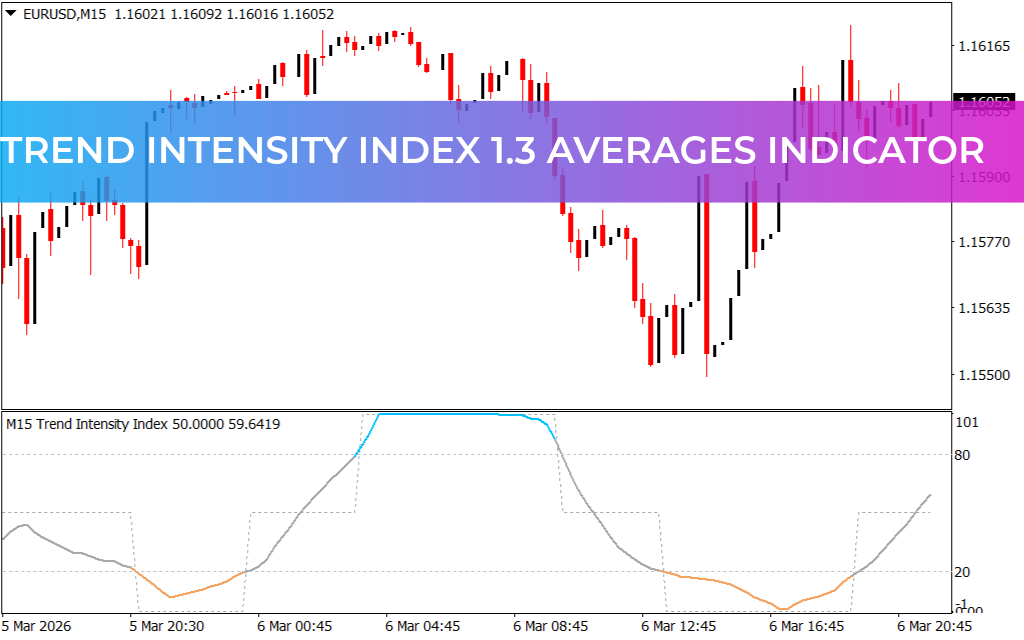
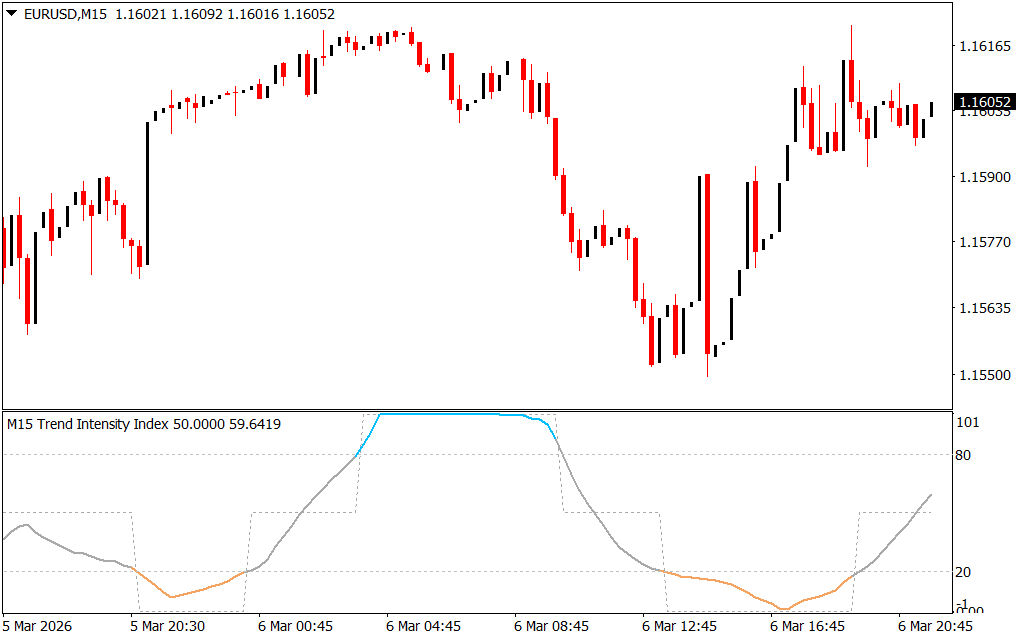
The Trend Intensity Index 1.3 Averages (MTF) is a powerful MT4 Trend Indicator designed to analyze market bias and the strength of price trends. It helps traders identify whether the market is trending upward or downward while also indicating overbought and oversold conditions.
This indicator is particularly useful for trend-following traders who aim to capitalize on sustained market movements by buying during uptrends and selling during downtrends. With multi-timeframe (MTF) support, traders can evaluate market trends across different time horizons for better trading decisions.
Key Features of Trend Intensity Index 1.3 Averages (MTF)
1. Trend Strength Analysis
The indicator tracks trend momentum and market direction, helping traders understand whether the current trend is strong or weakening.
2. Overbought and Oversold Levels
It identifies potential reversal zones using two key levels:
- Below 20 → Oversold market
- Above 80 → Overbought market
These zones help traders anticipate possible trend reversals or continuation opportunities.
3. Color-Coded Signal Line
The indicator uses a colored signal line in a separate window to display market conditions:
- Brown Line → Oversold conditions
- Gray Line → Strong ongoing trend
- Blue Line → Overbought conditions
4. Multi-Timeframe Capability (MTF)
The indicator can be customized to analyze trends across multiple timeframes, making it adaptable for both short-term and long-term trading strategies.
Trend Intensity Index Buy and Sell Signals
The indicator provides trading signals based on the index level and color changes.
Buy Signal
- The index drops below 20 and turns brown, indicating an oversold market.
- When the value moves back above 20, the trend begins shifting upward.
- If the line turns gray, it confirms a strong bullish trend and traders may consider long positions.
Sell Signal
- When the index rises above 80, the market enters an overbought zone.
- A sell opportunity appears when the indicator drops back below 80.
- If the line changes to gray, it confirms bearish momentum and traders can consider short positions.
Example Trading Strategy
- Wait for the indicator to drop below 20, signaling an oversold condition.
- Enter a buy trade once the index moves back above 20 and turns gray, confirming bullish momentum.
- Hold the position while the trend remains strong.
- Consider closing the trade when the indicator approaches above 80, indicating an overbought condition.
This strategy helps traders stay in profitable trades while the trend remains strong.
Trading Tips
- Use the indicator alongside Support And Resistance levels to improve entry accuracy.
- Combine it with trend indicators or moving averages for better confirmation.
- Avoid trading during sideways or choppy markets, as the indicator may produce inconsistent signals.
Conclusion
The Trend Intensity Index 1.3 Averages (MTF) for MT4 is a versatile indicator that helps traders evaluate trend direction, market strength, and overbought/oversold conditions. Its combination of trend analysis and momentum signals makes it an excellent tool for both beginner and advanced traders.
With its multi-timeframe capability, traders can adapt the indicator to different market conditions and develop effective trend-following strategies.
FAQ
Published:
Mar 07, 2026 08:08 AM
Category: