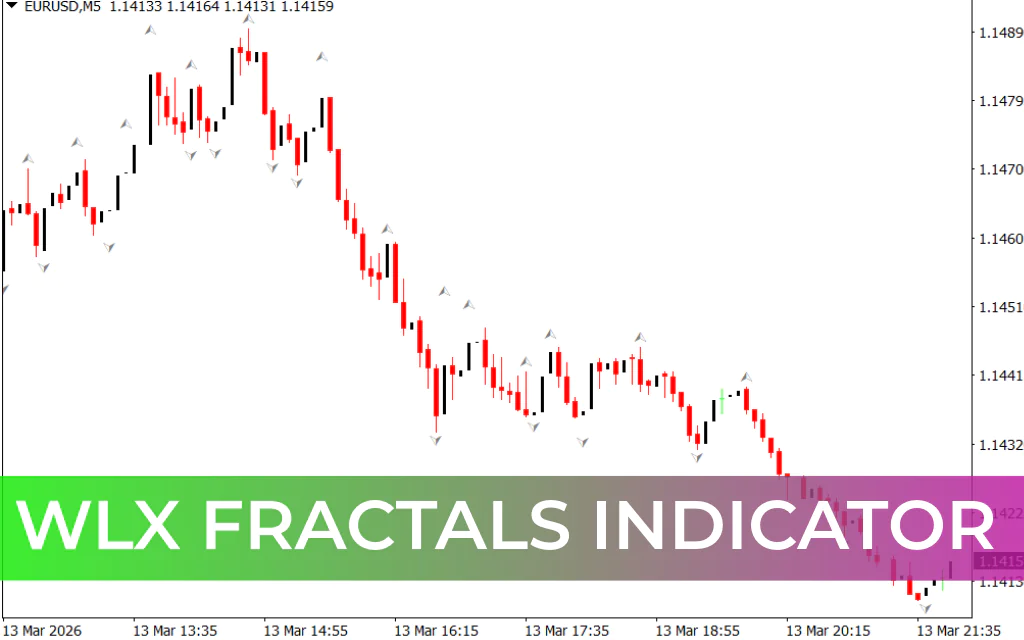
The WLX Fractals Indicator is a simple and effective trend detection tool designed for MetaTrader 4. It is based on the classic Fractal Indicator developed by Bill Williams, which is widely used to identify potential market reversals and trend direction.
Fractals appear when there is a shift in Market Structure, indicating that the price may be preparing to move in a new direction. The WLX Fractals indicator follows this same concept but simplifies the analysis by clearly marking signals directly on the chart.
Instead of forcing traders to manually detect patterns, the indicator plots arrows on the chart to highlight potential trading opportunities.
- Red arrow → potential bullish movement
- Blue arrow → potential bearish movement
These visual signals help traders quickly recognize entry and exit points.
How the WLX Fractals Indicator Works
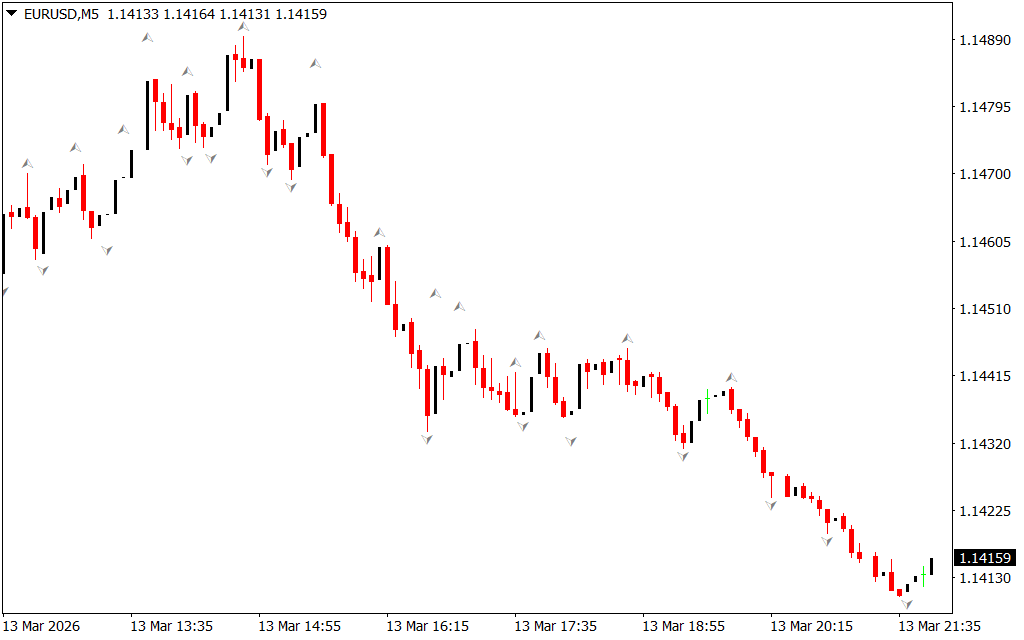
The indicator displays two types of arrows on the chart:
- Up arrows
- Down arrows
Each arrow indicates the current state of the trend and where the market may move next.
When a red arrow appears, it signals that bullish momentum may be developing, suggesting a potential buying opportunity.
When a blue arrow appears, it signals that bearish pressure may be increasing, suggesting a possible selling opportunity.
However, traders should be aware that the indicator may occasionally print multiple arrows in different colors during unstable market conditions. Waiting for Trend Confirmation can help reduce false signals.
WLX Fractals Buy Strategy
Follow these steps for a buy setup:
- The indicator plots a red arrow on the chart.
- Wait for the trend to begin forming.
- Enter a buy trade when the red arrow appears or shortly after.
- Place the stop-loss near the recent swing low.
- Exit the trade when a blue arrow appears, indicating a potential reversal.
This setup suggests that bullish momentum may be starting.
WLX Fractals Sell Strategy
Follow these steps for a sell setup:
- The indicator plots a blue arrow on the chart.
- Wait for the trend confirmation.
- Enter a sell trade when the blue arrow appears or shortly after.
- Place the stop-loss near the recent swing high.
- Exit the trade when a red arrow appears, signaling a possible Trend Reversal.
This setup indicates growing bearish pressure in the market.
Important Trading Tip
Although the WLX Fractals indicator is simple to use, it may produce false signals on shorter timeframes due to market noise.
For more reliable signals:
- Use the indicator on higher timeframes such as H1, H4, or Daily charts.
- Combine it with other indicators like the Relative Strength Index (RSI) or Moving Average Convergence Divergence (MACD).
- Wait for trend confirmation before entering trades.
Conclusion
The WLX Fractals Indicator is a beginner-friendly tool that helps traders quickly identify trend direction and potential market reversals. By plotting simple arrow signals on the chart, it removes the complexity of manually identifying fractal patterns.
While it can be used as a standalone indicator, combining it with momentum or trend indicators can significantly improve signal accuracy and help traders make better-informed decisions.
FAQ
1 Download
Published:
Mar 14, 2026 07:57 AM
Category: