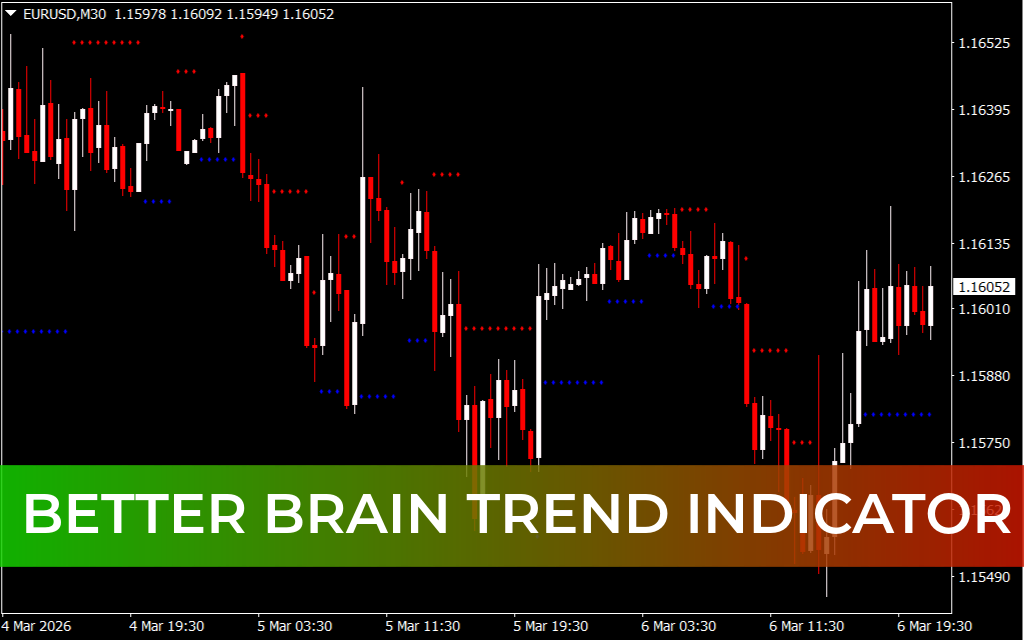
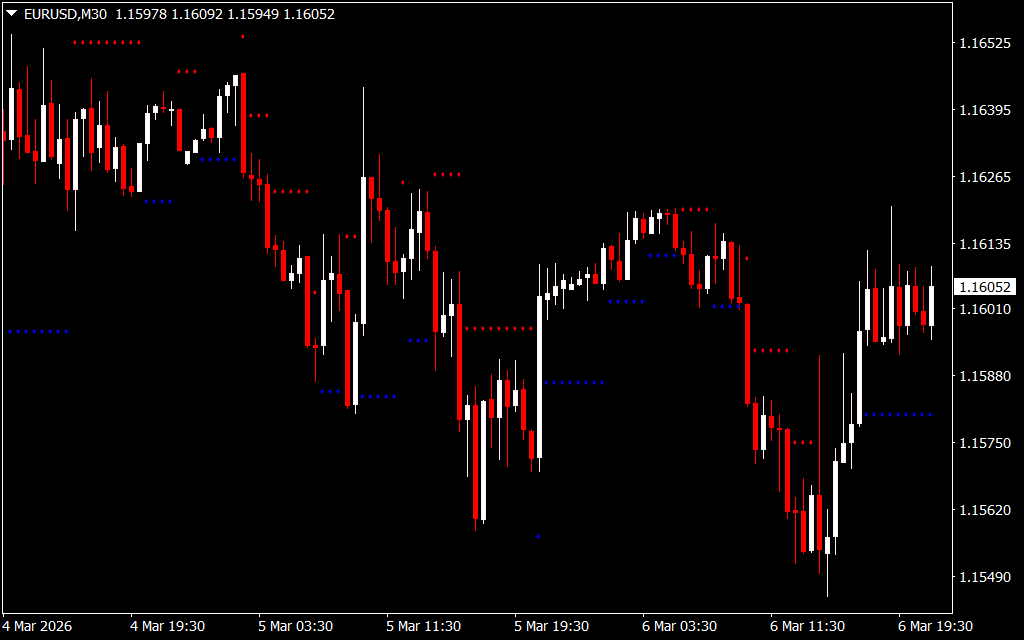
The Better Brain Trend Indicator for MT4 is a powerful technical analysis tool designed to identify trend direction, Support And Resistance levels, and potential price breakouts. By analyzing recent market highs and lows, the indicator helps traders anticipate trend reversals and strong momentum moves in the forex and stock markets.
This indicator uses an advanced algorithm combined with the Average True Range (ATR) to evaluate market volatility and detect changes in market sentiment. As a result, traders can identify potential breakout opportunities and trade in the direction of the prevailing trend.
Because of its clear visual signals and breakout-focused approach, the Better Brain Trend Indicator is suitable for both beginner and experienced traders using the MT4 platform.
How the Better Brain Trend Indicator Works
The Better Brain Trend indicator analyzes recent swing highs and swing lows to determine potential support and resistance levels.
It then plots colored dots directly on the chart to highlight these levels:
- Red Dots – Indicate potential resistance levels
- Blue Dots – Indicate potential support levels
These levels help traders understand where price may pause, reverse, or break out.
The indicator also evaluates price movement relative to the Average True Range (ATR) to measure volatility and determine whether the market is gaining momentum.
Trading Signals with the Better Brain Trend Indicator
The indicator provides signals based on breakouts and pullbacks around the plotted support and resistance levels.
Sell Trade Setup
A sell opportunity appears when:
- The market is in a bearish trend.
- Price breaks below a support level (blue dots).
- Momentum continues downward after the breakout.
Trade Strategy:
- Enter a SELL position after a confirmed support breakout.
- Place the stop loss above the nearest resistance level.
- Ride the trend until momentum weakens or an opposite signal appears.
Buy Trade Setup
A buy signal can occur when:
- The market shows bullish momentum.
- Price breaks above a resistance level (red dots).
- The breakout is supported by strong Price Action.
Trade Strategy:
- Enter a BUY position after a confirmed resistance breakout.
- Set the stop loss below the nearest support level.
- Hold the trade while the bullish trend remains strong.
Identifying Market Consolidation
Sometimes the support and resistance dots appear very close to each other. This usually indicates market consolidation or a sideways trading range.
During consolidation:
- Price moves within a tight range.
- Breakouts can occur in either direction.
Therefore, traders should carefully analyze price action around these levels before entering a trade.
Tips for Better Trading Results
To improve accuracy while using the Better Brain Trend Indicator, traders can combine it with other technical tools such as:
- Moving averages for Trend Confirmation
- Price action patterns
- Volume analysis
- Momentum indicators
Combining indicators helps confirm signals and reduce false breakouts.
Conclusion
The Better Brain Trend Indicator for MT4 is a reliable tool for identifying support and resistance levels, breakout opportunities, and trend direction. By tracking recent market highs and lows and incorporating ATR-based volatility analysis, it helps traders spot profitable trading opportunities with greater confidence.
When combined with moving averages or price action strategies, the indicator becomes even more effective for trading forex, stocks, and other financial markets on MetaTrader 4.
FAQ
Published:
Mar 08, 2026 07:19 AM
Category: