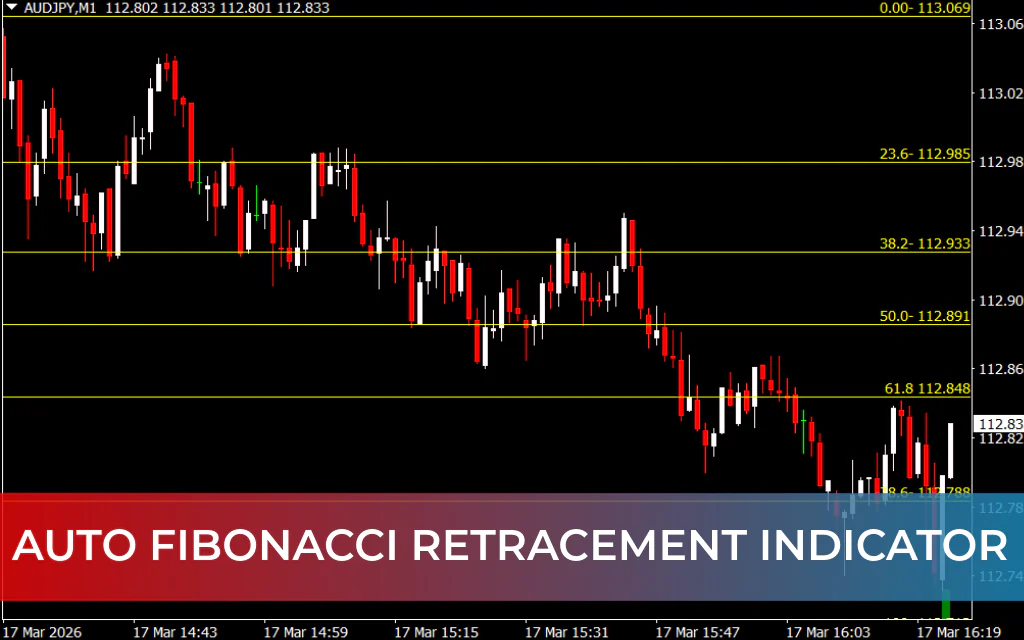
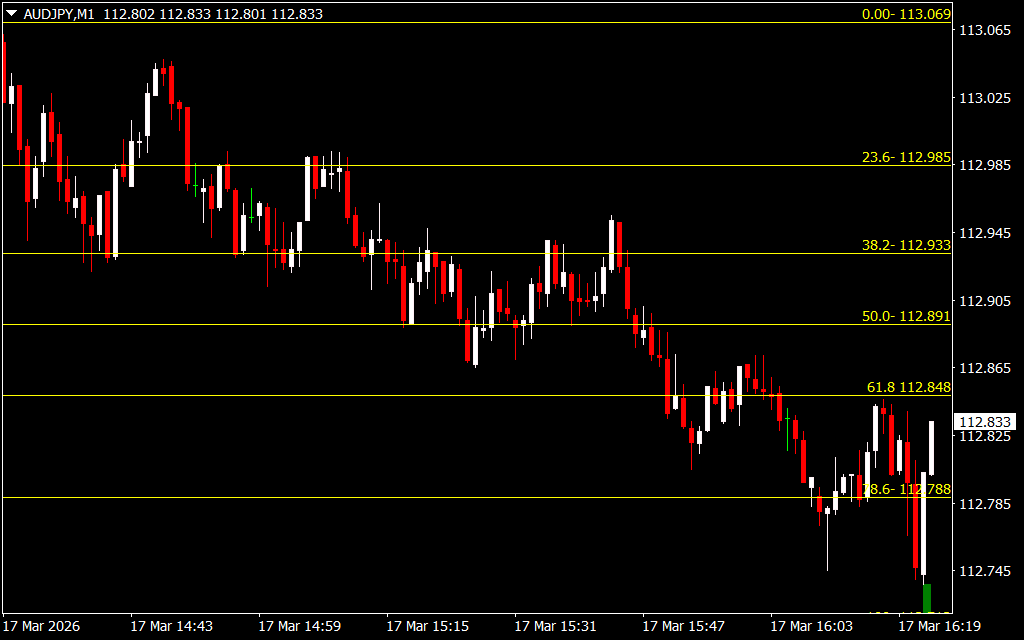
The Auto Fibonacci Retracement indicator is a powerful MT4 tool that automatically plots Fibonacci retracement levels on your chart, saving time and eliminating manual errors. It’s ideal for traders who want to quickly identify key Support And Resistance levels based on Fibonacci ratios.
What is Fibonacci Retracement?
Fibonacci retracement uses a sequence of numbers (0, 1, 1, 2, 3, 5, 8, 13…) to calculate key ratios that traders use to identify potential reversal levels in the market. The common ratios include 38.2%, 50%, 61.8%, and 78.6%, which represent points where price pullbacks or trend continuations often occur.
Manually drawing Fibonacci levels can be time-consuming and prone to mistakes, which is why the Auto Fibonacci Retracement indicator is highly useful.
How the Auto Fibonacci Retracement Indicator Works
- The indicator automatically identifies swing highs and lows and draws the Fibonacci levels between them.
- In an uptrend, 0% is at the low and 100% at the high; in a downtrend, 0% is at the high and 100% at the low.
- Traders can use these levels to:
- Enter trades on pullbacks (e.g., entering long near 38.2% or 61.8% in an uptrend).
- Set stop-losses below/above key levels (like 50% or 100%).
- Take profits at higher Fibonacci levels or aligned support/resistance zones.
Example Trading Scenario
- On a USDJPY M30 chart, the price retraces past 38.2% and 50% levels.
- When it hits 61.8%, the price pulls back slightly before resuming the uptrend.
- Entry could be at the 61.8% level, stop-loss just below the swing low, and take-profit at the 78.6% level or next resistance.
Pros and Cons
✅ Pros:
- Automatically identifies highs and lows for Fibonacci plotting.
- Eliminates manual drawing errors.
- Works on all timeframes and currency pairs.
- Ideal for trend continuation and pullback strategies.
- Beginner-friendly and easy to set up.
- Updates dynamically as new swing highs/lows form.
❌ Cons:
- Does not provide direct buy or sell signals.
- Can become visually cluttered if multiple Fibonacci zones are active.
- Best used in conjunction with other tools (support/resistance, Price Action, or candlestick patterns).
Best Practices for Using Auto Fibonacci
- Combine with price action analysis: Ensure Fibonacci levels align with key support/resistance zones or candlestick patterns.
- Focus on high-probability retracement levels like 61.8% and 78.6%.
- Use multi-timeframe analysis to confirm the trend direction on higher charts before entering trades on lower timeframes.
- Consider adding trend filters like moving averages or oscillators to increase accuracy.
FAQ
⚡ Does this indicator work on MT5?
Currently, this version is for MT4, but a similar MT5 version is available.
🎨 Does it repaint or redraw past levels?
No. Once a Fibonacci level is plotted based on confirmed highs/lows, it stays fixed until a new structure forms.
🛠️ Can I customize Fibonacci levels?
The MT4 version comes with standard preset levels. Some builds allow basic customization via settings.
🔗 Can I combine it with price action strategies?
Absolutely. The indicator becomes much more reliable when Fibonacci levels coincide with support/resistance zones or candlestick reversal patterns.
Conclusion
The Auto Fibonacci Retracement indicator is an essential tool for traders who want to save time and increase accuracy when analyzing pullbacks and trend continuation levels. While it doesn’t give direct buy/sell signals, it provides clear entry, stop-loss, and take-profit zones. When combined with price action or other indicators, it becomes a highly effective trading aid.
FAQ
3 Downloads
Published:
Mar 17, 2026 11:25 AM
Category: