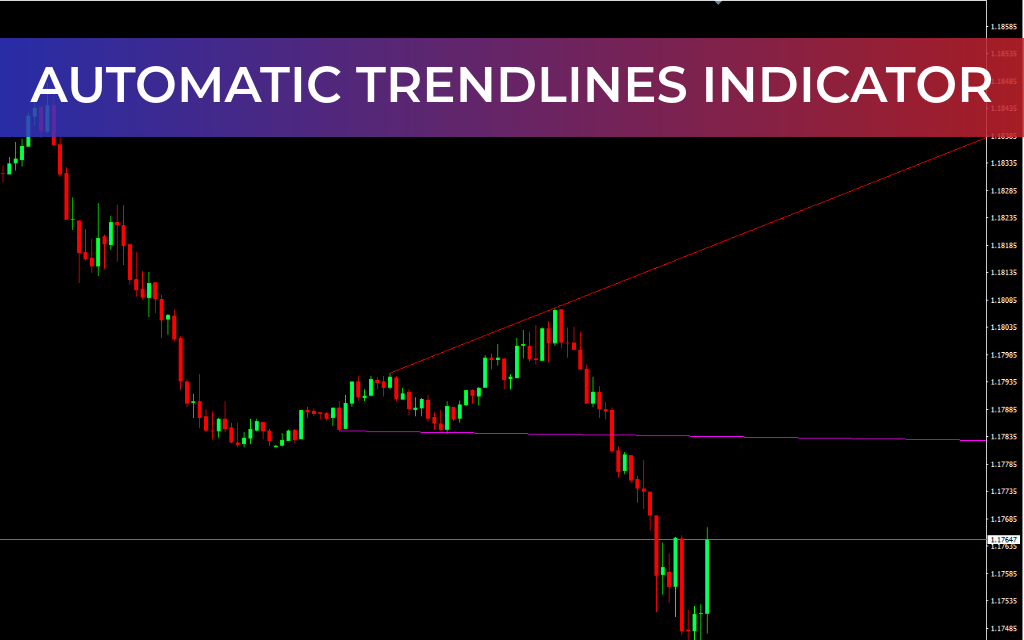
The Automatic Trendlines Indicator for MetaTrader 4 is an advanced tool designed to automatically identify and draw trendlines with precision. While traders traditionally draw trendlines manually using different methods, this indicator simplifies the process by using Widner’s oscillator to generate trendlines automatically and objectively.
This powerful tool is especially useful for traders who rely on trendlines, support, and resistance as the foundation of their trading strategies. Since these elements are essential for identifying market direction and potential reversal zones, accurate and consistent trendline plotting is critical for effective decision-making.
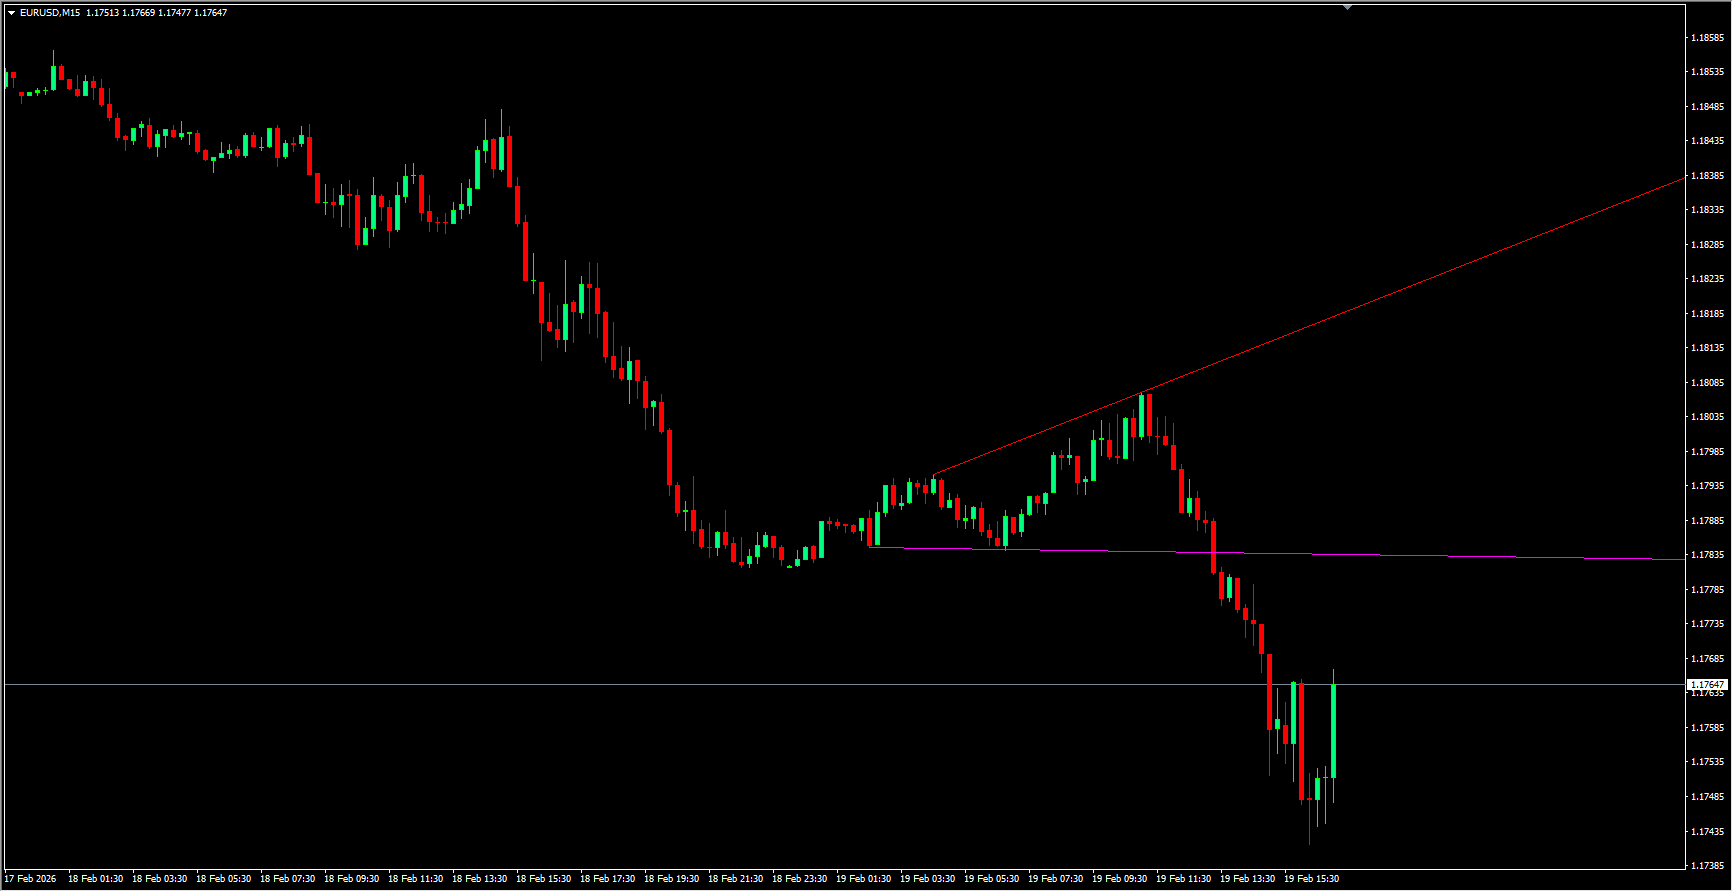
The indicator analyzes recent price data to draw relevant trendlines and automatically removes outdated or redundant ones. It also projects trendlines into the future, helping traders anticipate potential Support And Resistance levels, market movements, and reversal points.
Key Benefits
Automatically detects and plots trendlines using advanced calculations
Removes irrelevant or outdated trendlines
Projects future support and resistance levels
Helps anticipate breakouts and reversals
Supports both beginner learning and advanced strategy development
Enhances trendline breakout and bounce trading strategies
How to Trade Using the Automatic Trendlines Indicator
Traders can use the automatically drawn trendlines to implement strategies based on trendline breakouts and trendline failures (bounces).
Trendline Breakout Trading
A breakout signals strong momentum and indicates the price may continue moving beyond support or resistance.
If a downtrend line breaks, traders may consider a sell position with stop loss above the previous high.
If an uptrend line breaks, traders may consider a buy position with stop loss below the previous low.
Trendline Failure (Bounce Trading)
When price fails to break a trendline, it suggests weakening momentum and a potential reversal.
If price fails to break a downtrend line, traders may consider a buy position with stop loss below the trendline.
If price fails to break an uptrend line, traders may consider a sell position with stop loss above the previous high.
Learning and Strategy Development
The indicator is particularly helpful for beginners who want to understand how trendlines are identified and applied in trading. By observing the automatically generated lines, new traders can learn proper trendline construction techniques.
Experienced traders can also benefit by comparing their manually drawn trendlines with those generated by the indicator, improving accuracy and consistency in analysis.
Conclusion
The Automatic Trendlines Indicator for MT4 is a practical and efficient tool for traders who rely on trendlines and support/resistance analysis. By automating trendline detection and projecting future levels, it helps traders anticipate market behavior and refine their strategies.
Available as a free download, this indicator is ideal for both beginners learning technical analysis and experienced traders seeking faster, more consistent trendline plotting. For best results, it is recommended to combine the indicator with Price Action analysis.
FAQ
1 Download
Published:
Feb 19, 2026 10:15 AM
Category: