The Williams AD MA Indicator is a powerful technical analysis tool for MetaTrader 4 that combines two popular indicators: the Williams Accumulation Distribution (AD) and Moving Average (MA). By merging these indicators, traders can better evaluate market pressure, Trend Strength, and potential price direction.
This indicator helps determine whether a currency pair is experiencing accumulation (buying pressure) or distribution (selling pressure). Understanding these market phases allows traders to assess whether a trend is strong enough to continue or likely to reverse.
The Williams AD MA indicator also integrates three Linear Weighted Moving Averages (LWMA), which place greater importance on recent price data. This makes the indicator more responsive and accurate when detecting current market trends.
Indicator Components
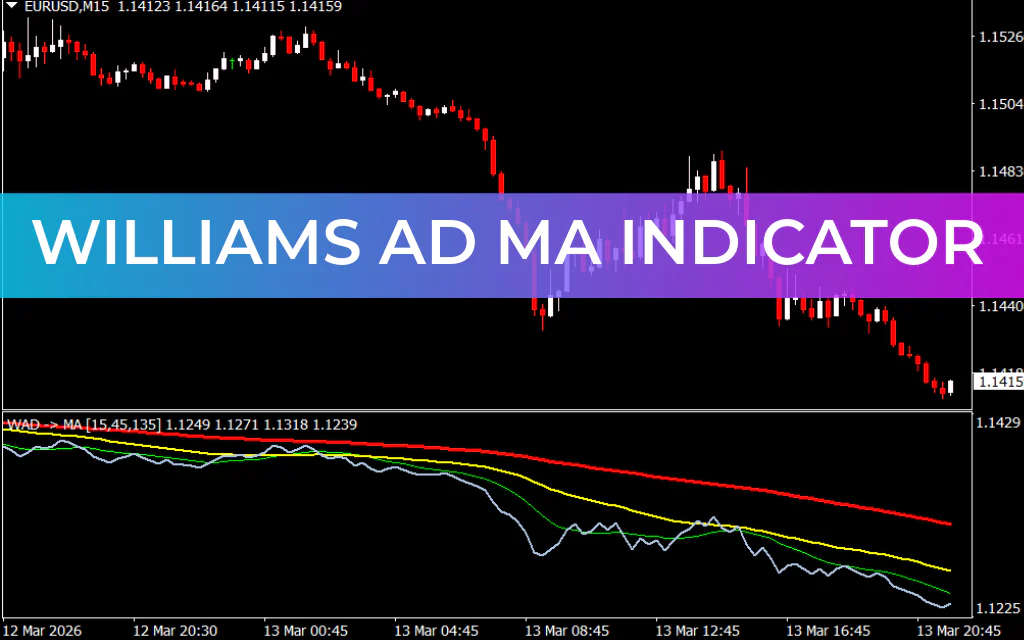
The Williams AD MA indicator displays several lines on the chart:
- Accumulation Distribution Line (Light Steel Blue) – Shows whether the market is accumulating or distributing.
- Fast Moving Average – 15 LWMA (Lime) – Reacts quickly to recent price changes.
- Medium Moving Average – 45 LWMA (Yellow) – Often acts as a dynamic support or trailing stop level.
- Slow Moving Average – 135 LWMA (Red) – Helps identify the broader market trend.
Because Linear Weighted Moving Averages prioritize recent price activity, they can provide more accurate signals than traditional moving averages.
How the Williams AD MA Indicator Works
The Accumulation Distribution (AD) line reflects buying and selling pressure in the market.
- When the AD line rises, it signals accumulation, meaning buyers are dominating the market.
- When the AD line falls, it signals distribution, meaning sellers are controlling price movement.
Sometimes the indicator may show divergence, which can signal a potential Trend Reversal:
- If the AD line rises while price is falling, buyers may be quietly accumulating positions.
- If the AD line falls while price is rising, selling pressure may be building.
These signals can help traders anticipate future price movements before they become obvious on the chart.
Buy Signal
A buy signal appears when the indicator confirms strong bullish pressure.
Trade setup:
- The AD line trends upward and moves above the moving average lines.
- The fast MA (15 LWMA – green) crosses the 45-period MA (yellow) from below.
- All moving averages begin to slope upward.
- Enter a buy trade after confirmation.
This setup suggests that accumulation is supporting an emerging uptrend.
Sell Signal
A sell signal occurs when selling pressure increases and the market begins trending downward.
Trade setup:
- The AD line trends downward and moves below the moving averages.
- The fast MA (15 LWMA) crosses the 45-period MA from above.
- The moving averages start sloping downward.
- Enter a sell trade after confirmation.
This indicates that distribution is driving the market lower.
Stop Loss and Trade Management
The 45-period moving average often works well as a dynamic trailing stop-loss level.
For example:
- In an uptrend, price tends to stay above the 45-period MA.
- In a downtrend, price generally remains below it.
Using this line as a trailing stop helps traders protect profits while allowing trades to run.
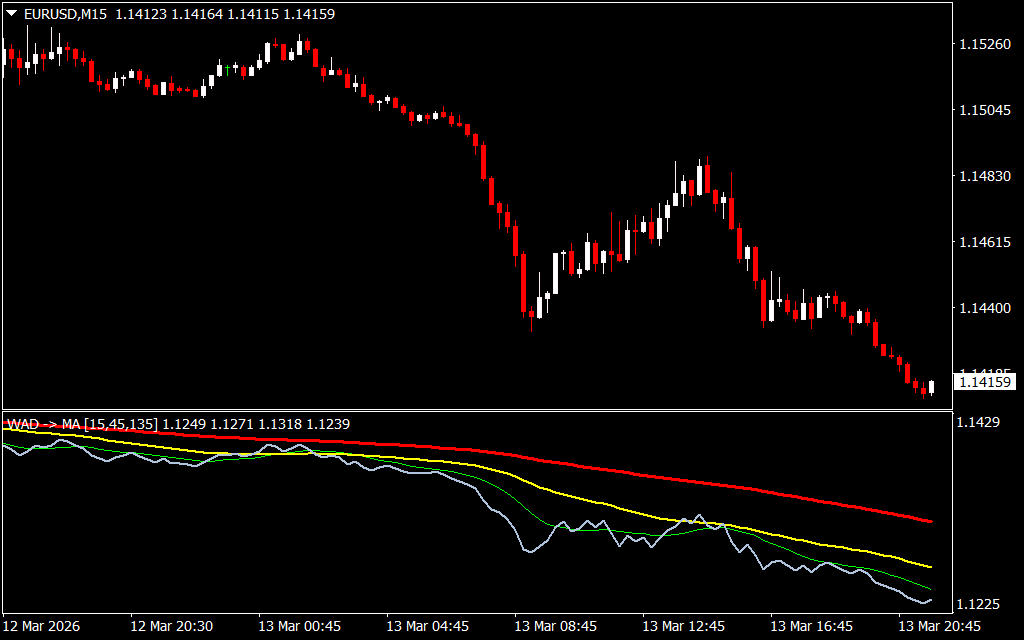
Chart Example
Consider a chart showing the price movement of the GBP/EUR currency pair:
- At the start of a downtrend, the AD line slopes downward and crosses below the moving averages.
- The fast MA also crosses downward, confirming bearish momentum.
- Throughout the downtrend, the AD line remains below the moving averages.
Later, when the trend reverses:
- The AD line crosses above the moving averages.
- The moving averages begin rising.
- This indicates strong buying pressure and a bullish trend.
Conclusion
The Williams AD MA Indicator is a practical tool for traders who want to combine trend analysis with market pressure insights. By integrating the Accumulation Distribution line with multiple moving averages, it helps identify strong trends, potential reversals, and reliable entry points.
Its clear signals and simple structure make it suitable for both beginner and experienced forex traders. When used alongside Price Action analysis or other technical indicators, it can significantly improve trading decisions and strategy performance.
FAQ
1 Download
Published:
Mar 14, 2026 07:45 AM
Category: