The TMA Slope True Indicator for MetaTrader 4 (MT4) is a powerful trading tool designed to analyze market trends and momentum with precision. By leveraging Triangular Moving Averages (TMA) and measuring their slope, this indicator provides traders with clear insights into Trend Strength and direction. Its intuitive visual cues, customizable parameters, and adaptability make it an essential tool for traders looking to optimize entries, exits, and overall trading performance.
How the TMA Slope True Indicator Works
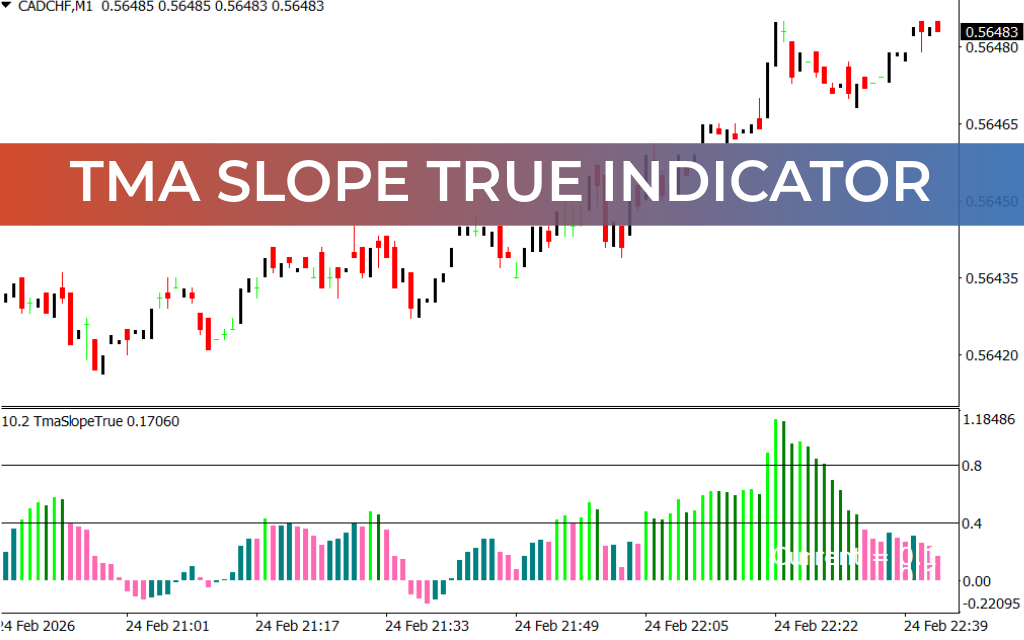
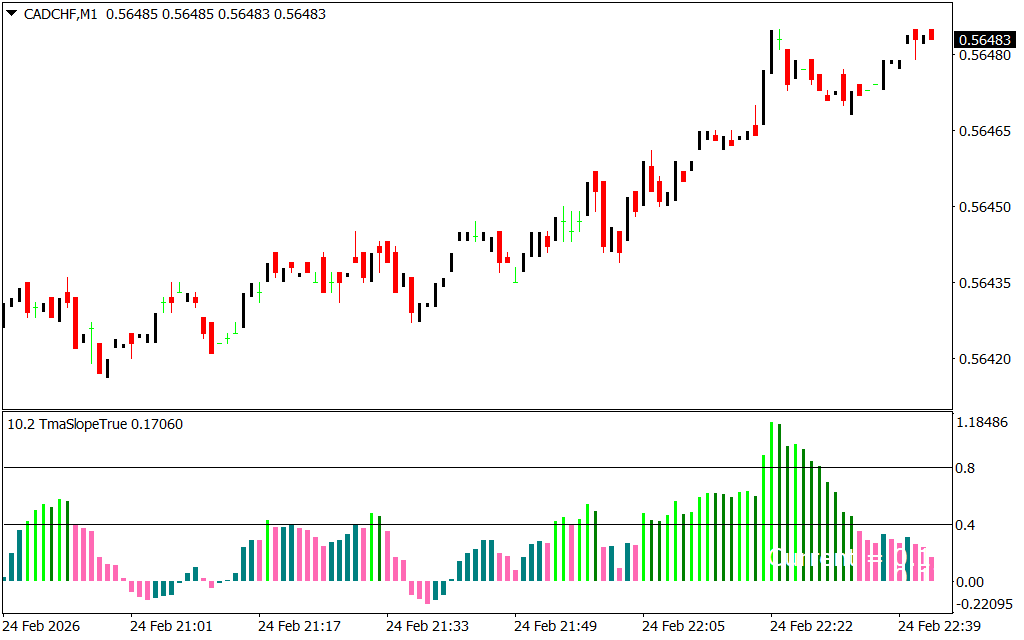
The indicator generates actionable buy and sell signals by analyzing the slope of the TMA:
- Buy Signal: A positive slope is indicated by green bars, reflecting bullish momentum and a potential buying opportunity.
- Sell Signal: A negative slope is shown with red bars, signaling bearish momentum and a potential selling opportunity.
- Neutral/Flat Market: White bars indicate low or indecisive momentum, helping traders avoid uncertain conditions.
The visual histogram and slope calculations provide an easy-to-read overview of market trends, while dynamic adjustments to market conditions allow traders to detect trend strength, continuation, or reversal opportunities.
Key Features
- Real-time trend and momentum analysis
- Visual histogram with color-coded slopes (green, red, white)
- Customizable alerts and time frame selection
- Suitable for Scalping, intraday, and swing trading
- Helps identify trend strength, continuation, or reversal opportunities
- User-friendly and adaptable for traders of all levels
Conclusion
The TMA Slope True Indicator for MT4 simplifies complex market data into actionable trading signals by analyzing the slope of the Triangular Moving Average. It empowers traders to spot trends accurately, improve entry and exit timing, and make more informed trading decisions. Whether you’re a beginner or an experienced trader, this indicator provides the tools to gain a competitive edge in the market.
FAQ
5 Downloads
Published:
Feb 24, 2026 16:45 PM
Category: