The EMAs Indicator for MetaTrader 4 (MT4) combines three Exponential Moving Averages (EMA) to help traders identify trend reversals and potential market direction changes. This indicator is designed to be clean, lightweight, and chart-friendly, ensuring it does not interfere with your existing technical analysis setup.
By analyzing the interaction between multiple EMAs, the indicator highlights buy and sell opportunities directly on the chart using easy-to-read histogram signals. This makes it suitable for traders who want a simple visual confirmation of trend momentum.
Why the EMA Is a Powerful Trading Indicator
The Exponential Moving Average (EMA) is widely used in forex trading because it reacts quickly to price movements compared to traditional moving averages.
Key benefits of the EMA include:
- Faster response to price changes
- Helps identify trend direction
- Useful for spotting divergence
- Acts as dynamic Support And Resistance
- Helps confirm buy and sell entries
Because of its responsiveness, the EMA is particularly popular among scalpers, day traders, and swing traders who need timely signals.
How the EMAs Indicator Works
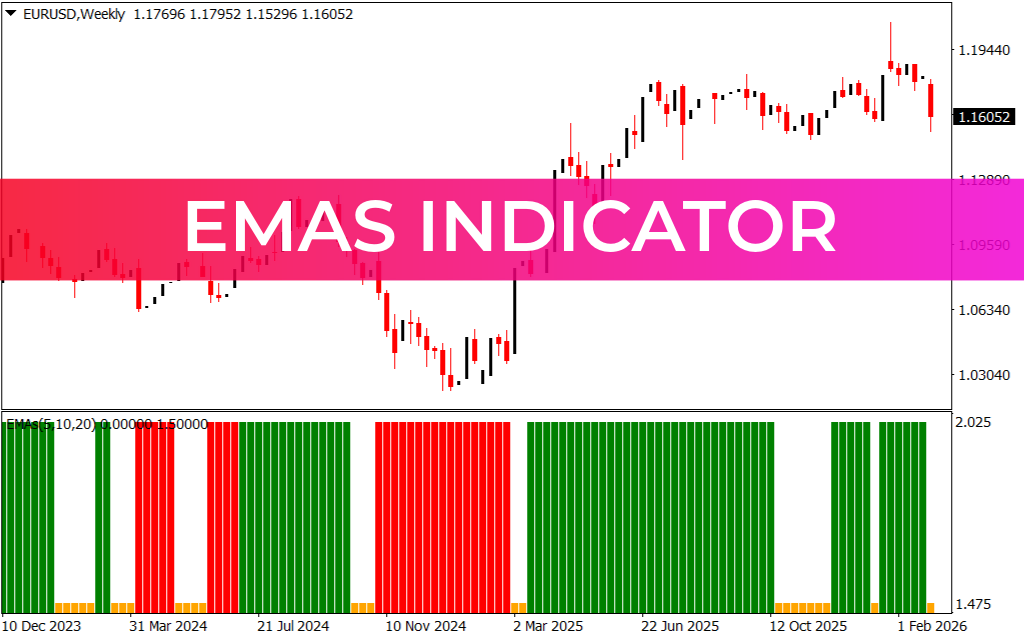
The EMAs Indicator generates signals when the three EMA lines cross each other. These signals are displayed as histogram bars below the price chart.
Signal types include:
- Green Histogram Bars – Indicate a potential bullish trend or buy opportunity.
- Red Histogram Bars – Suggest a potential bearish trend or sell opportunity.
- Orange Histogram Bars – Indicate a sideways or directionless market.
This visual approach helps traders quickly understand market momentum without cluttering the chart.
How to Trade With the EMAs Indicator
When applied to a chart, the indicator helps traders identify Trend Reversal points and trade entries.
For example, on the EUR/USD H4 timeframe, green histogram bars often appear when a bullish trend begins. Traders may consider entering a buy position when the indicator confirms bullish momentum.
Example Buy Setup
- Wait for green histogram bars to appear.
- Confirm the signal with Price Action or support/resistance levels.
- Enter a buy trade once price returns to a strong zone such as an order block or support level.
Example Sell Setup
- Watch for red histogram bars indicating bearish momentum.
- Confirm with price action or additional indicators.
- Enter a sell trade when price retraces to a resistance or supply zone.
Important Trading Tip
Like most technical indicators, the EMAs Indicator is not immune to false signals. For best results, it should be used together with:
- Price action analysis
- Support and resistance levels
- Trendline confirmation
- Other technical indicators
Using multiple confirmations increases the accuracy of trading decisions.
Conclusion
The EMAs Indicator for MT4 is a simple yet powerful trend reversal tool that helps traders quickly identify potential buy and sell opportunities. Its histogram-based signals make it easy to interpret, making it suitable for beginner, intermediate, and advanced traders.
It works effectively across different trading styles, including:
- Scalping
- Intraday trading
- Day trading
- Swing trading
Best of all, the indicator is completely free to download and easy to install on MetaTrader 4.
FAQ
1 Download
Published:
Mar 07, 2026 15:57 PM
Category: