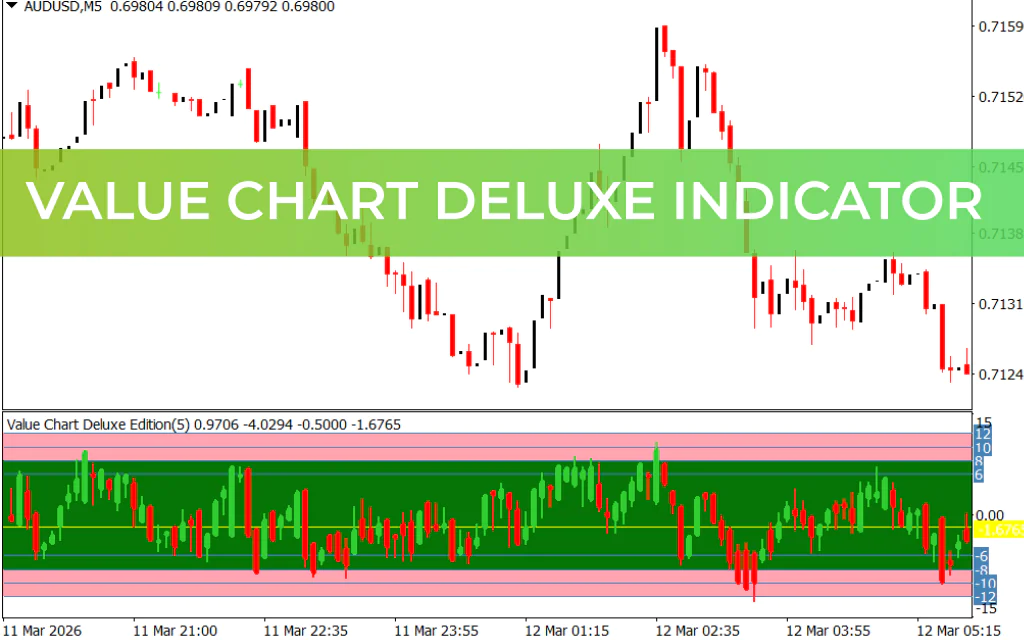
The Value Chart Deluxe Indicator for MT4 is a powerful technical analysis tool designed to help traders identify market cycles, overbought and oversold conditions, and potential reversal zones. By analyzing price behavior and highlighting key turning points, the indicator makes it easier to determine ideal buy and sell zones in the forex market.
Built for the MetaTrader 4 trading platform, this indicator evaluates current market conditions and compares them with historical price data to reveal where the true market value may lie.
Because of its ability to detect price extremes and turning points, the Value Chart Deluxe indicator is widely used by traders who rely on Price Action and market cycle analysis.
What Is the Value Chart Deluxe Indicator?
The Value Chart Deluxe indicator is designed to measure the relative value of price movements within the market. It highlights when the market is trading at unusually high or low levels compared to its normal range.
This allows traders to easily spot:
- Overbought conditions
- Oversold conditions
- Potential reversal zones
- Key Support And Resistance areas
By visualizing these extreme conditions, the indicator helps traders identify high-probability entry points during market cycles.
Key Features of the Value Chart Deluxe Indicator
The indicator provides several analytical capabilities that make it a useful addition to many trading strategies.
Main Features
- Identifies overbought and oversold market levels
- Highlights major turning points in price
- Helps detect support and resistance zones
- Useful for spotting divergence signals
- Works well with price action strategies
- Suitable for both beginners and experienced traders
Because the indicator simplifies complex market analysis, traders can quickly locate areas of interest where price may reverse.
How the Value Chart Indicator Works
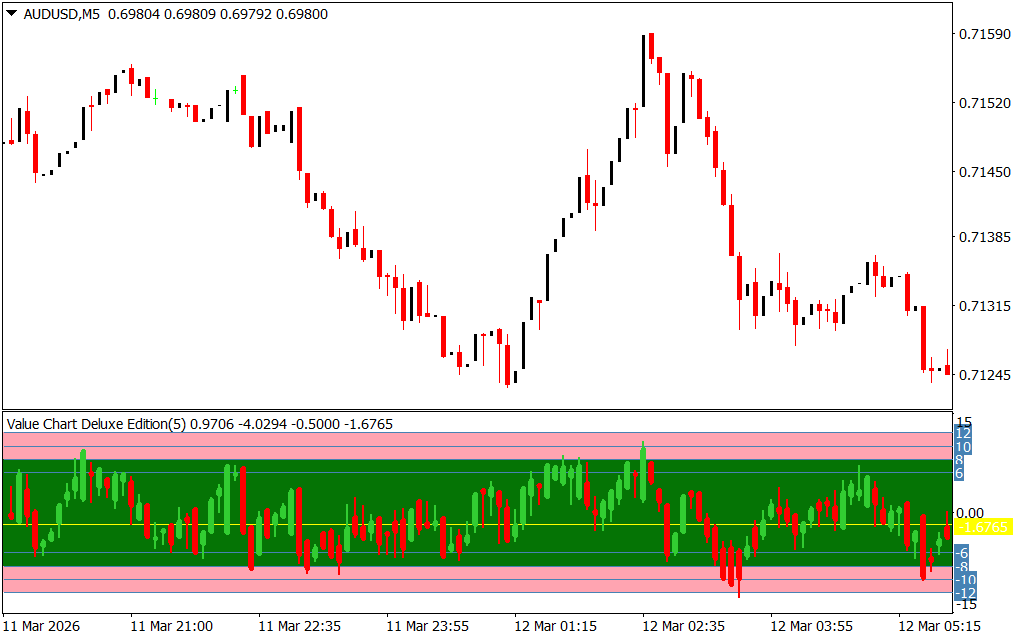
The Value Chart Deluxe indicator appears in a separate sub-window beneath the price chart in MetaTrader 4.
It analyzes price data and places it within a value range, highlighting when price reaches extreme levels.
These extreme levels signal that the market may be:
- Overbought: Price may be due for a downward correction
- Oversold: Price may be ready for an upward move
By tracking these zones, traders can anticipate potential market reversals or pullbacks.
How to Trade with the Value Chart Deluxe Indicator
Although the indicator can provide valuable insights on its own, it is recommended to use it together with other indicators or price action analysis for better trade confirmation.
Buy Setup
Follow these steps to identify a potential buy opportunity:
- Wait for price action or another indicator to suggest a bullish move.
- Check the Value Chart Deluxe indicator in the sub-window.
- Look for the candlestick touching or entering the oversold region.
- Enter a BUY/LONG position once the bullish setup is confirmed.
This setup suggests that the market may be undervalued and ready to move upward.
Sell Setup
For a potential sell trade, follow this approach:
- Wait for price action or other indicators to signal a possible bearish move.
- Check the Value Chart Deluxe indicator for confirmation.
- Look for the candlestick touching the overbought region.
- Enter a SELL/SHORT position after confirmation.
This indicates the market may be overvalued and ready for a downward correction.
Why Traders Use the Value Chart Deluxe Indicator
The Value Chart Deluxe indicator is popular among forex traders because it helps identify price extremes and market cycles.
Key benefits include:
- Clear visualization of overbought and oversold levels
- Helps identify market turning points
- Supports divergence and reversal analysis
- Useful for finding high-probability entry zones
- Works well alongside existing trading strategies
Because of its straightforward design, it can be used by both beginner and professional traders.
Conclusion
The Value Chart Deluxe Indicator for MT4 is an effective tool for detecting market extremes and potential reversal zones. By analyzing price behavior and highlighting key turning points, it helps traders identify optimal buy and sell opportunities.
When combined with proper risk management and other technical indicators, this tool can significantly improve your market analysis and trading decisions.
FAQ
9 Downloads
Published:
Mar 15, 2026 18:41 PM
Category: