Divergence trading is one of the most reliable techniques for identifying early bullish and bearish trend reversals in the forex market. However, spotting divergences manually can be difficult and time-consuming. The FX5 MACD Divergence Indicator for MetaTrader 4 (MT4) simplifies this process by automatically scanning charts and alerting traders whenever a divergence occurs.
This indicator analyzes the relationship between MACD lines and the MACD histogram to detect divergence patterns. When a divergence is identified, the indicator marks it directly on the chart and provides arrow-based BUY and SELL signals, helping traders quickly recognize potential trading opportunities.
The indicator detects two main types of divergences:
- Regular Divergence – displayed with solid lines
- Reverse Divergence (Hidden Divergence) – displayed with dotted lines
By identifying both types, the indicator provides traders with more opportunities to enter the market.
Understanding Divergence Signals
Regular Bullish Divergence
A regular bullish divergence appears when:
- The price creates a new lower low
- The indicator forms a higher low
This suggests weakening bearish momentum and a potential upward Trend Reversal.
Reverse Bullish Divergence (Hidden Divergence)
A reverse bullish divergence occurs when:
- The price forms a higher low
- The indicator forms a lower low
This pattern often signals trend continuation in an existing bullish market.
Bearish Divergence
The opposite conditions apply for bearish divergence:
- The price forms higher highs
- The indicator forms lower highs
This indicates weakening bullish momentum and a potential downward reversal.
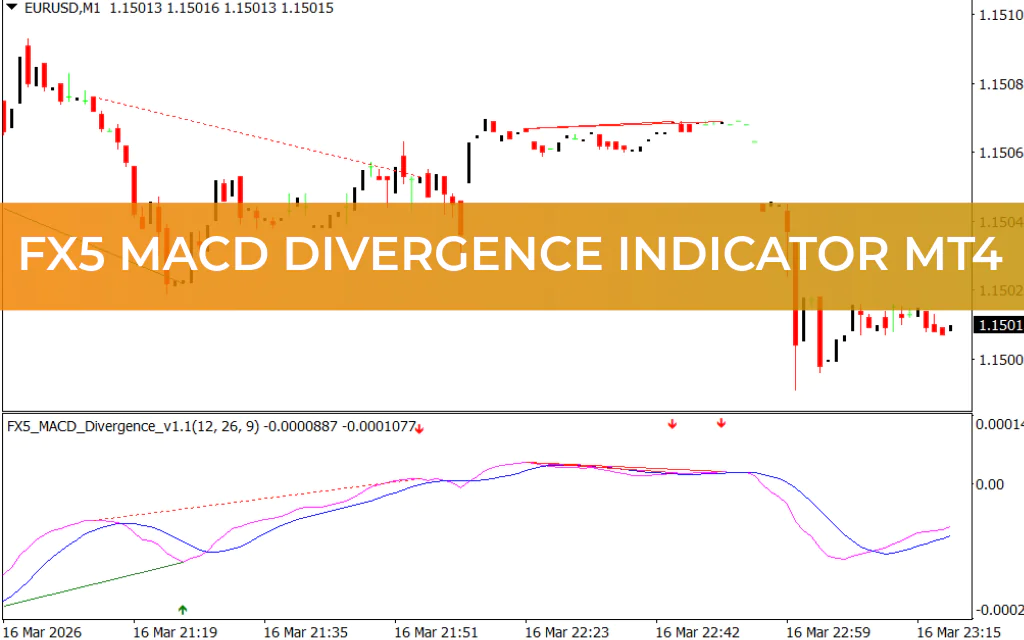
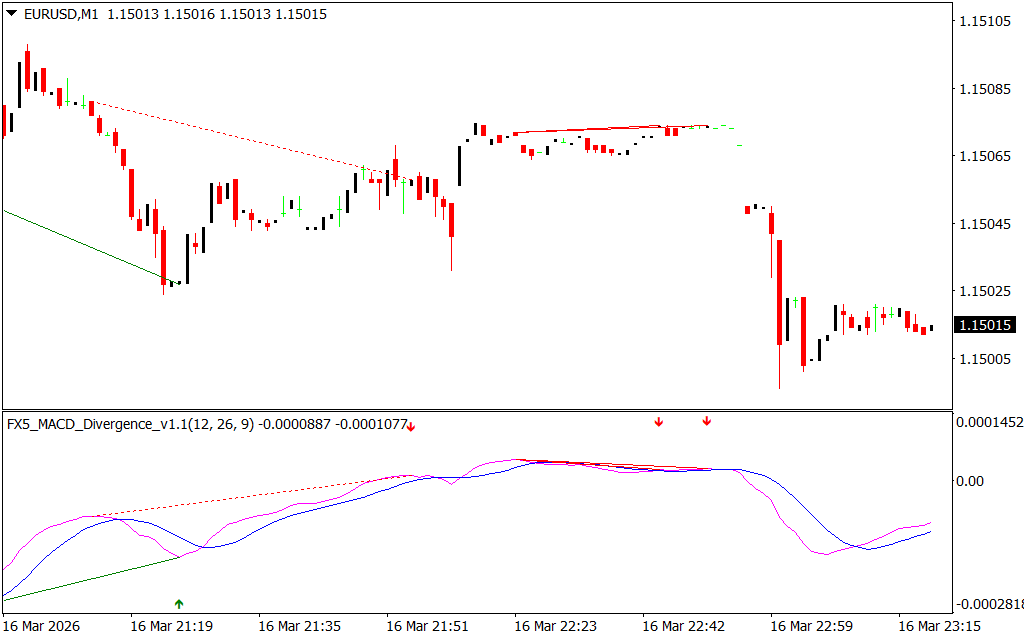
FX5 MACD Divergence Indicator Trading Signals
On an EURJPY H4 chart, the indicator automatically identifies divergences and displays them with clear visual elements:
- Green lines: Bullish divergence
- Red lines: Bearish divergence
- Magenta and Blue lines: MACD indicator lines
- Arrow signals: BUY and SELL trading alerts
These visual markers help traders easily understand the relationship between Price Action and momentum.
To prevent repainting issues, the indicator confirms signals after one completed candle. Although this introduces a slight delay, it significantly improves the reliability and accuracy of trading signals.
Experienced traders often confirm these signals using the traditional MACD indicator before entering trades.
Key Features of the FX5 MACD Divergence Indicator
This MT4 indicator offers several powerful features for traders:
- Automatically detects regular and hidden divergences
- Displays clear BUY and SELL arrows
- Plots divergence lines directly on the chart
- Provides signal alerts
- Works on all timeframes
- Suitable for forex, stocks, and other financial markets
- Free to download and use
For beginners, the indicator eliminates the complexity of manually identifying divergences. For experienced traders, it acts as a fast scanning tool that highlights potential setups immediately.
Best Timeframes for Trading
The FX5 MACD Divergence Indicator can be used on any timeframe. However, for higher accuracy and stronger signals, many traders prefer using higher timeframes such as:
- H1 (1 Hour)
- H4 (4 Hours)
- Daily charts
Higher timeframes typically provide more reliable divergence signals and reduce market noise.
Conclusion
The FX5 MACD Divergence Indicator for MT4 is an essential tool for traders who rely on divergence trading strategies. By automatically detecting both regular and hidden divergences, the indicator helps traders identify potential trend reversals and continuation opportunities with ease.
With visual divergence lines, arrow signals, and built-in alerts, this indicator significantly simplifies technical analysis. Whether you trade forex, stocks, or other financial markets, the FX5 MACD Divergence Indicator can enhance your trading strategy and help you spot high-probability market opportunities.
FAQ
1 Download
Published:
Mar 16, 2026 18:20 PM
Category: