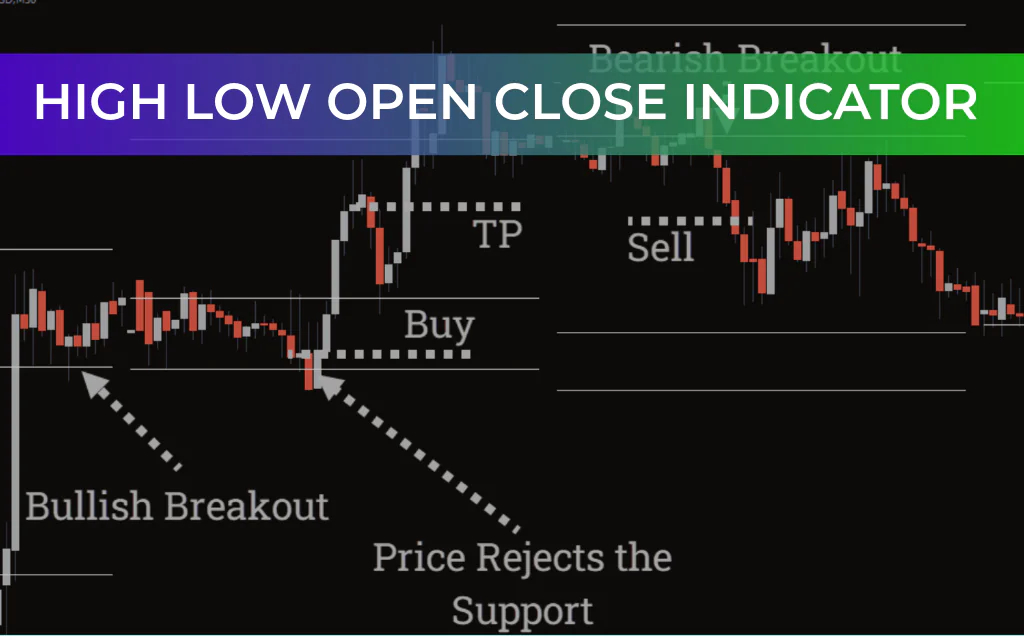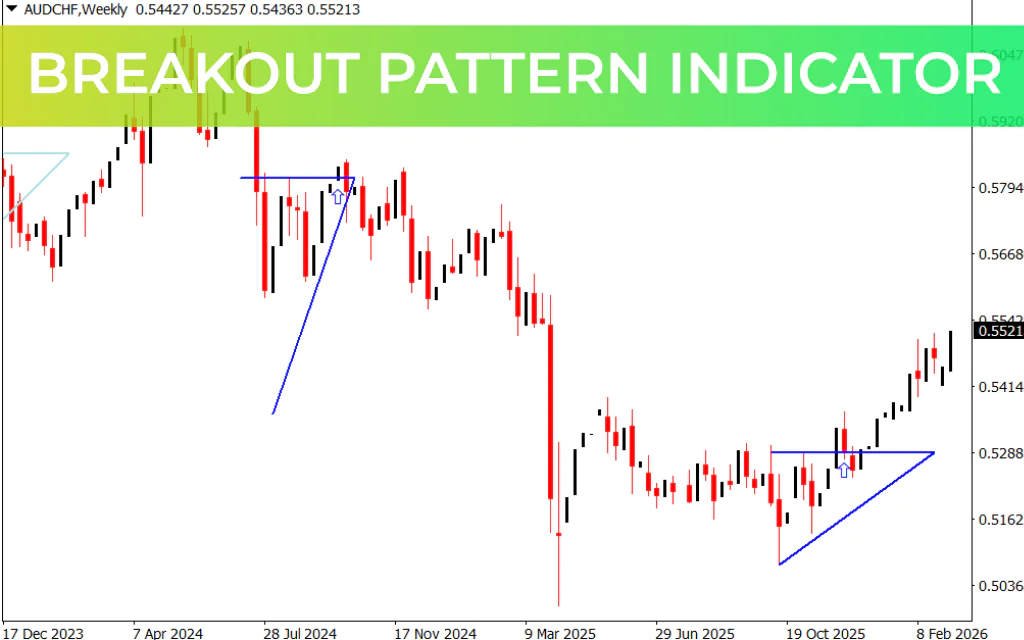
The Breakout Pattern Indicator for MT4 is a straightforward technical tool designed to help traders identify market breakouts quickly. Breakouts occur when the price moves beyond key support or resistance levels, often leading to strong price momentum. This indicator simplifies the process by visually marking breakout patterns directly on the chart.
The indicator displays open triangles to highlight potential breakout points. These triangles come in two colors:
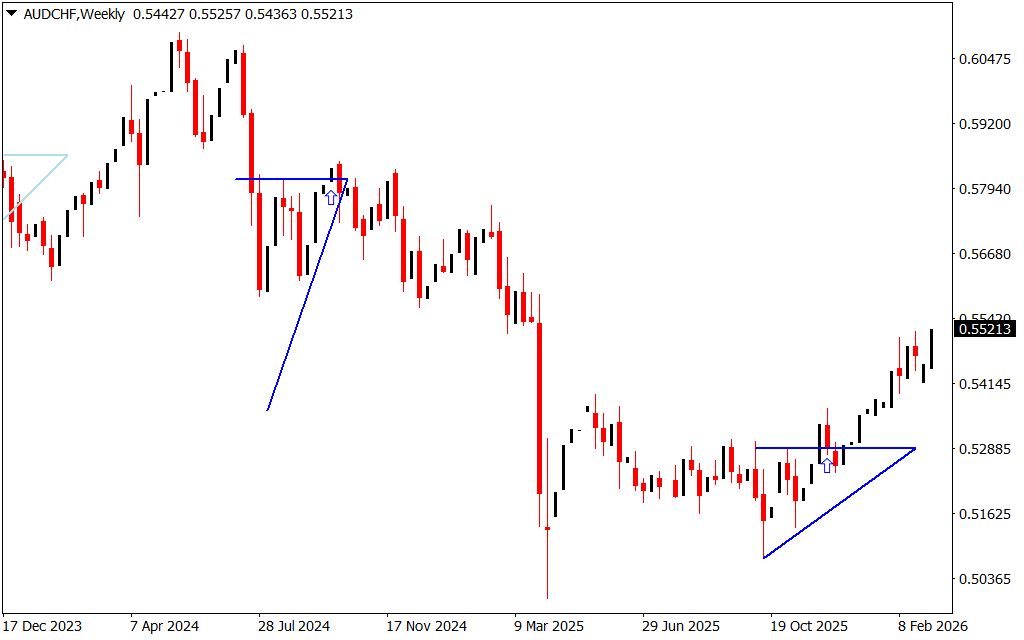
- Blue triangles indicate bullish breakout opportunities.
- Red triangles signal potential bearish breakouts.
In addition to triangles, the indicator also plots directional arrows on the chart. These arrows act as confirmation signals that reinforce the breakout direction and help traders make more confident trading decisions.
Because breakouts can occur across different market conditions, the Breakout Pattern Indicator can be applied to all timeframes, from short-term intraday charts to longer-term trading setups.
Breakout Pattern Indicator Buy and Sell Signals
The indicator uses a combination of triangles and arrows to generate trading signals.
Buy Signal
A buy signal appears when the indicator plots a blue triangle, indicating a bullish breakout. Shortly after, a blue arrow appears on the chart to confirm the upward trend.
Once both signals appear, traders may consider opening a long position in the direction of the breakout.
Sell Signal
A sell signal occurs when the indicator displays a red triangle, signaling a potential bearish breakout. This is followed by a red arrow, which confirms the downward momentum.
Traders may open short positions after the confirmation arrow appears.
How the Breakout Pattern Indicator Works
The Breakout Pattern Indicator analyzes Price Action and highlights breakout formations using visual markers. When the market breaks through important price levels, the indicator plots a triangle to indicate the direction of the breakout.
The arrows then appear as confirmation signals, helping traders validate the breakout before entering a trade.
This combination of signals allows traders to easily identify:
- Bullish breakout setups
- Bearish breakout setups
- Potential trend continuation opportunities
What is the Best Breakout Indicator?
There is no single indicator that guarantees perfect breakout signals. However, several popular indicators are commonly used to identify breakout opportunities, including:
- Relative Strength Index (RSI)
- Moving Averages
- Bollinger Bands
- Breakout Pattern Indicator
Combining breakout indicators with Support And Resistance analysis can improve trading accuracy and reduce false signals.
Conclusion
The Breakout Pattern Indicator for MT4 is a helpful tool for traders who want to identify breakout opportunities quickly and visually. By plotting triangles for breakout patterns and arrows for confirmation, the indicator makes it easier to detect bullish and bearish trade setups.
Traders can use the signals to enter trades in the direction of the breakout across any timeframe. With proper risk management and confirmation from other indicators, the Breakout Pattern Indicator can become a valuable part of a breakout trading strategy.
FAQ
1 Download
Published:
Mar 10, 2026 08:39 AM
Category: