The SMA Crossover Indicator for MT4 is a trend-following technical tool designed to help traders identify market direction and potential buy/sell opportunities. It is widely applicable across forex, stocks, and cryptocurrency markets, making it a versatile addition to any trader’s toolkit.
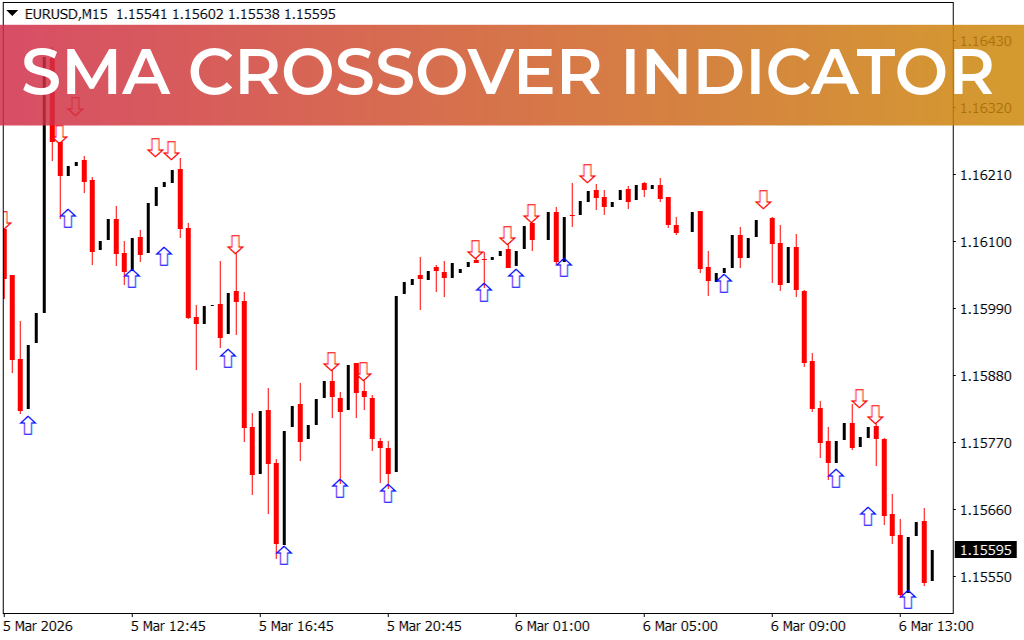
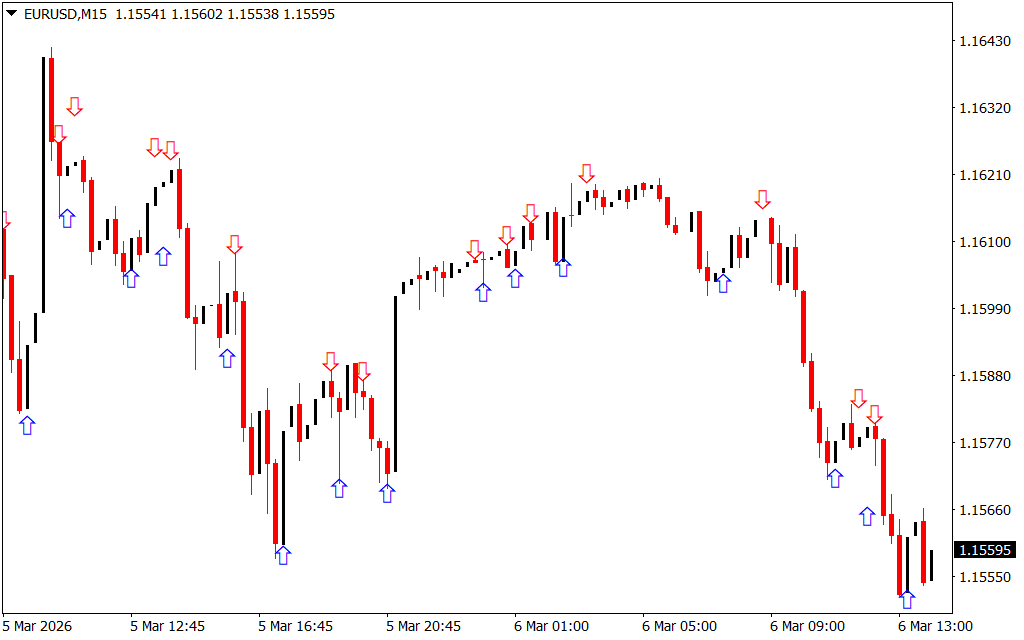
Unlike single moving averages, this indicator uses two Simple Moving Averages (SMAs) with different periods to detect crossovers and market trend shifts. When the fast SMA crosses the slow SMA, the indicator automatically plots visual arrows on the chart, making it easier to identify trading signals.
How the SMA Crossover Indicator Works
The indicator applies two SMAs:
- Fast SMA – Reacts quickly to recent price movements
- Slow SMA – Filters out market noise and defines the main trend
Whenever the fast SMA crosses above the slow SMA, it generates a blue arrow, signaling a bullish trend. Conversely, when the fast SMA crosses below the slow SMA, a red arrow appears, indicating a bearish trend.
Default Settings
- Fast SMA: 1-period
- Slow SMA: 34-period
You can customize these settings to adjust signal frequency according to your trading style or market volatility.
How to Trade Using the SMA Crossover Indicator
Bullish Signal (Buy Setup)
- A blue arrow appears when the fast SMA crosses above the slow SMA.
- Confirm the trend using Price Action, e.g., price breaking above resistance or bouncing off support.
- Enter a buy trade in the direction of the trend.
Bearish Signal (Sell Setup)
- A red arrow appears when the fast SMA crosses below the slow SMA.
- Confirm the setup with price action, e.g., price rejection at resistance or breaking support.
- Enter a sell trade following the confirmed bearish trend.
This combination of SMA crossover signals and price action helps traders filter false entries and increase trade accuracy.
Key Advantages of the SMA Crossover Indicator
- Automatically detects trend direction with visual arrows
- Works on forex, stocks, and cryptocurrency charts
- Helps identify Support And Resistance zones
- Simple to interpret for beginner and advanced traders
- Can be combined with other indicators like RSI, MACD, or Bollinger Bands for added confirmation
- Customizable fast and slow SMA periods for different trading styles
Best Practices for Trading SMA Crossovers
- Use higher timeframes (H1, H4, D1) for trend-based trading
- Look for confluence with support/resistance zones
- Confirm signals with price action patterns or momentum indicators
- Avoid trading during sideways or low-volatility markets to reduce false signals
Conclusion
The SMA Crossover Indicator for MT4 is a simple yet effective trend-following tool that highlights potential bullish and bearish opportunities using moving average crossovers. By combining the indicator’s signals with price action confirmation, traders can improve trade accuracy and identify strong trend directions and support/resistance levels.
Whether for forex, stocks, or crypto, this tool provides a clear visual representation of market bias and potential trade entries.
FAQ
1 Download
Published:
Mar 06, 2026 08:04 AM
Category: