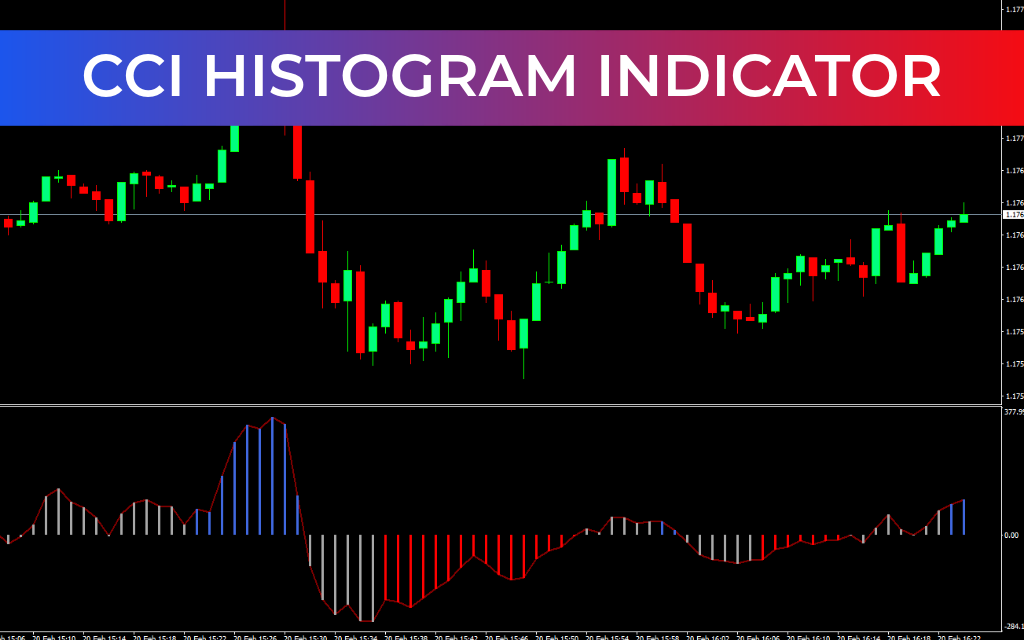
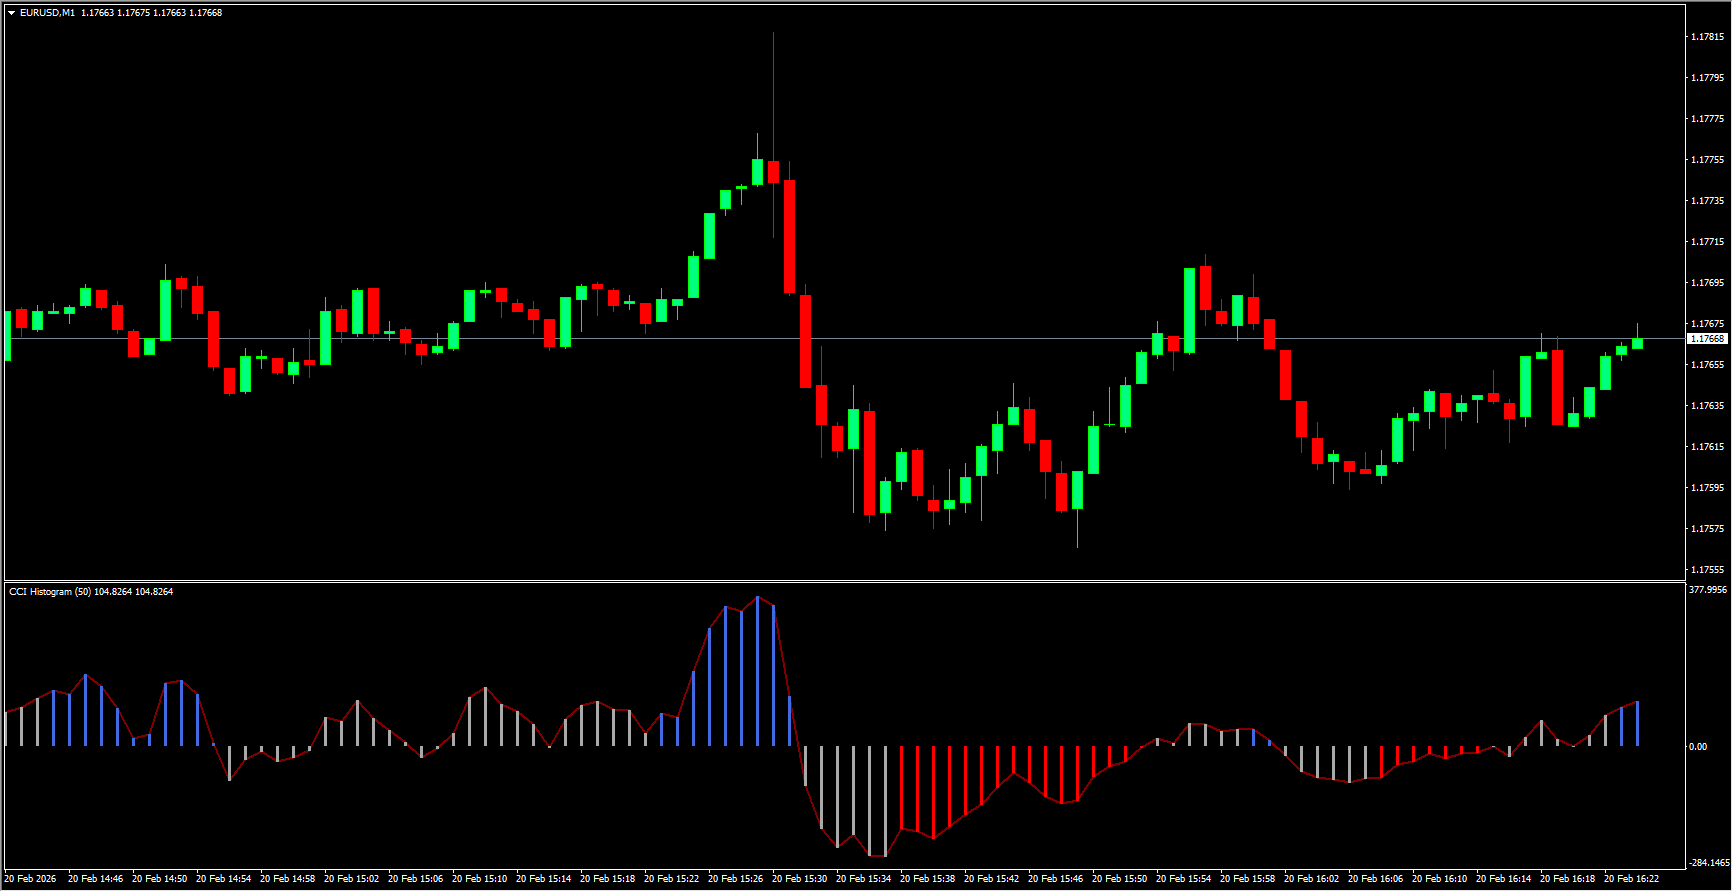
The CCI Histogram Indicator is built on the powerful and widely respected Woodies Commodity Channel Index (Woodies CCI) concept. It visually represents market conditions through a color-coded histogram, clearly identifying bullish, bearish, and flat market phases. As a non-repainting MT4 indicator, its signals remain stable once formed, making it reliable for decision-making and suitable for both manual and automated trading strategies.
The indicator delivers clear BUY and SELL signals through histogram color changes, allowing traders to quickly identify shifts in market momentum. It works effectively on any timeframe, making it suitable for both intraday and long-term trading. Its simplicity makes it accessible for beginners, while its precision and adaptability make it valuable for advanced traders as well.
CCI Histogram Indicator Trading Signals
The indicator displays market direction using three distinct colors:
Blue – Bullish trend
Red – Bearish trend
Dark Gray – Flat or weak trend
Buy Signal
Enter a BUY trade when the histogram turns blue, indicating the start of a bullish trend.
Place stop-loss below the previous swing low.
Exit when the histogram turns dark gray, signaling weakening momentum or a flat market.
Sell Signal
Enter a SELL trade when the histogram turns red, indicating the start of a bearish trend.
Place stop-loss above the previous swing high.
Exit when the histogram turns dark gray, signaling consolidation or reduced Trend Strength.
Aggressive Trading Approach
Some traders enter or exit positions immediately when the histogram switches between blue and red, ignoring flat signals. For improved accuracy, signals can be combined with Support And Resistance zones, trendlines, channels, or breakout strategies.
Because the indicator does not repaint, its signals are stable and can be integrated into automated trading systems with ease.
Conclusion
The CCI Histogram Indicator for MT4 is a highly effective tool for trend-based trading strategies. Its ability to clearly distinguish between bullish, bearish, and flat market conditions helps traders improve timing and avoid weak market phases. With visually clear signals, adaptability across timeframes, and non-repainting reliability, it can significantly enhance trading efficiency. The indicator is also easy to install and available for free, making it a practical choice for traders of all experience levels.
FAQ
1 Download
Published:
Feb 20, 2026 09:27 AM
Category: