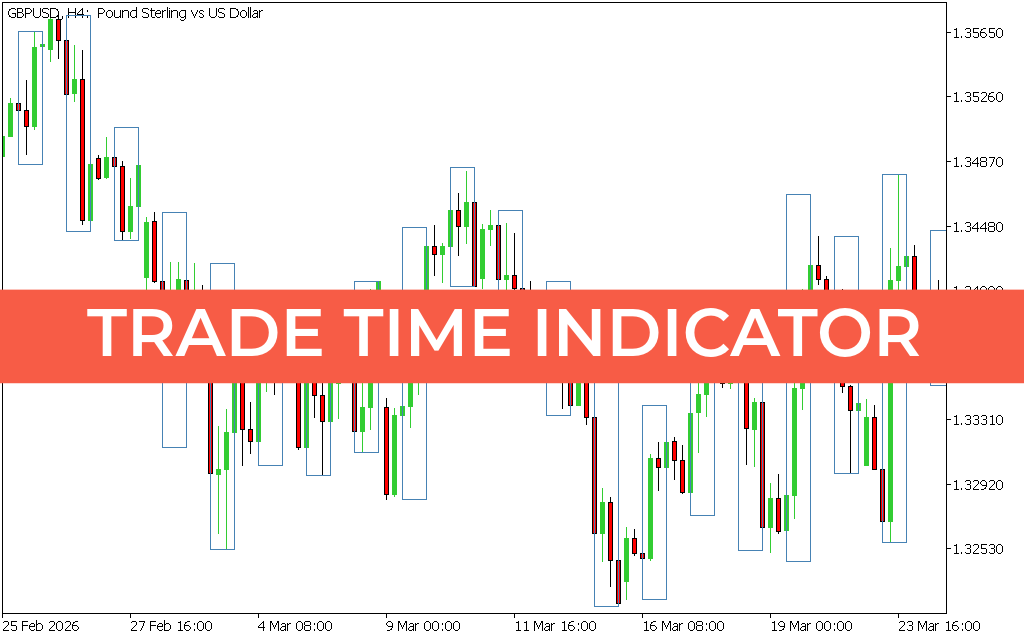
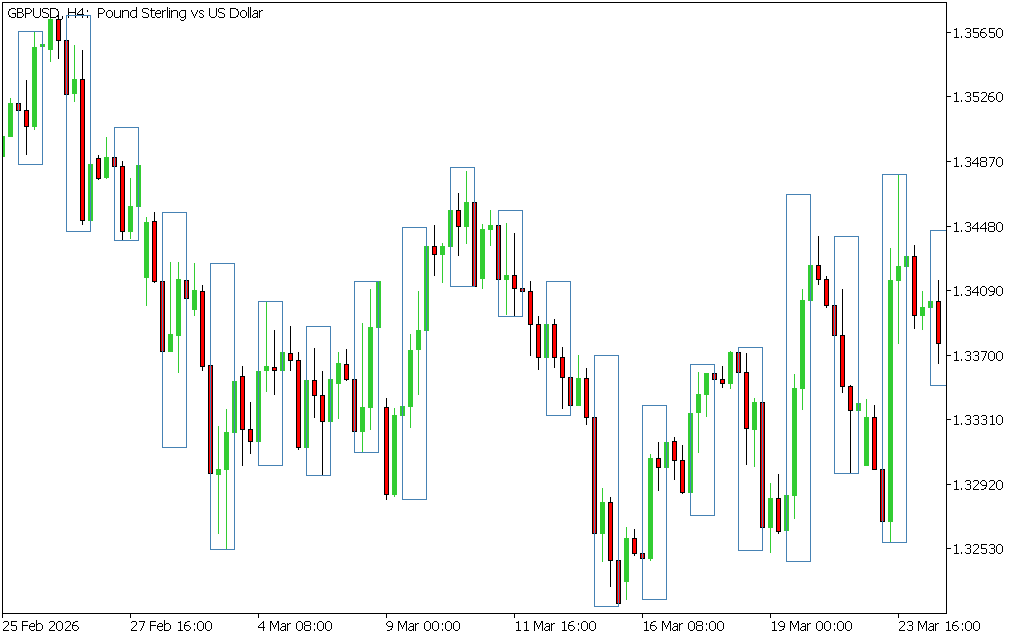
The Trade Time Indicator is a simple yet effective MT5 tool that helps traders identify the start and end of market trends. By drawing rectangles on candles based on the chosen timeframe, the indicator visually highlights when a trend begins and when it starts to fade. This makes it easier for traders to spot opportunities and manage positions with confidence.
Key Features
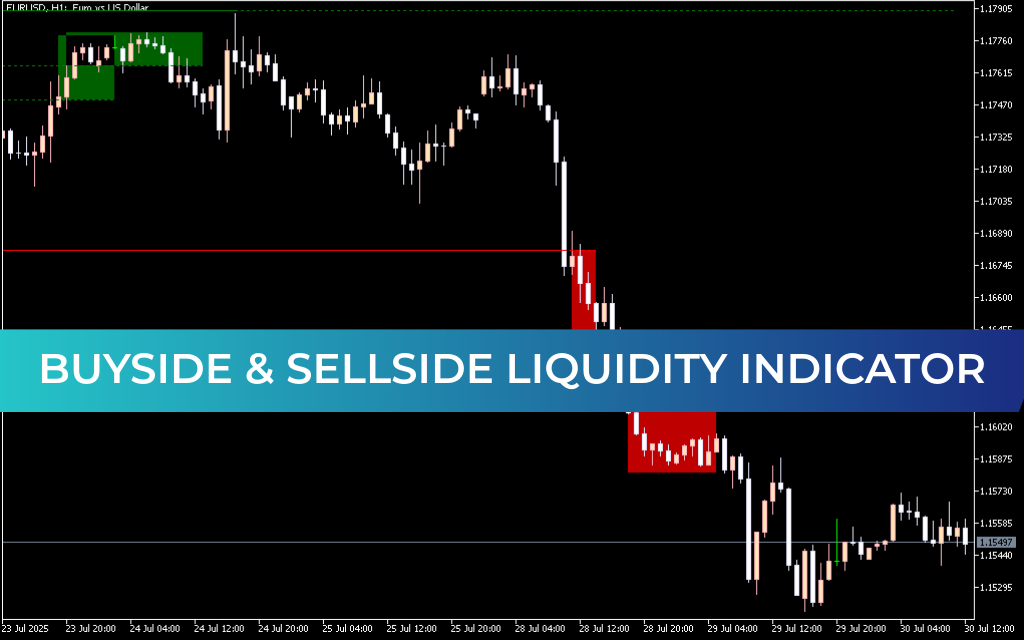
- Time-Based Trend Detection: Draws rectangles on candles to mark the beginning and end of trends.
- Multi-Timeframe Support: Works on all timeframes, with higher ones (H4, daily, weekly) recommended for accuracy.
- Clear Visual Signals: Rectangles highlight bullish or bearish candles at trend initiation.
- Easy Integration: Can be combined with RSI, MACD, or other indicators for confirmation.
How to Use the Trade Time Indicator
The indicator provides BUY and SELL signals by marking rectangles at the start of a trend:
- BUY Signal: A rectangle appears on a bullish candle at the beginning of an uptrend. Traders can open long positions.
- SELL Signal: A rectangle appears on a bearish candle at the start of a downtrend. Traders can enter short positions.
For example, on the GBP/USD H4 chart, the indicator clearly shows rectangles marking the start of bullish and bearish moves, helping traders align with the prevailing trend.
Benefits of Using the Indicator
- Simplifies Trend Analysis: Easy-to-read rectangles highlight market direction.
- Adaptable for All Traders: Suitable for beginners and professionals alike.
- Works Across Instruments: Effective for forex, stocks, and commodities.
- Free Download: Available at no cost for MT5 users.
Conclusion
The Trade Time Indicator is a time-based MT5 tool that visually marks the start and end of trends. By combining it with other indicators, traders can confirm signals and improve accuracy. Download it for free today and add time-based analysis to your trading strategy.
1 Download
Published:
Apr 11, 2026 13:09 PM
Category: