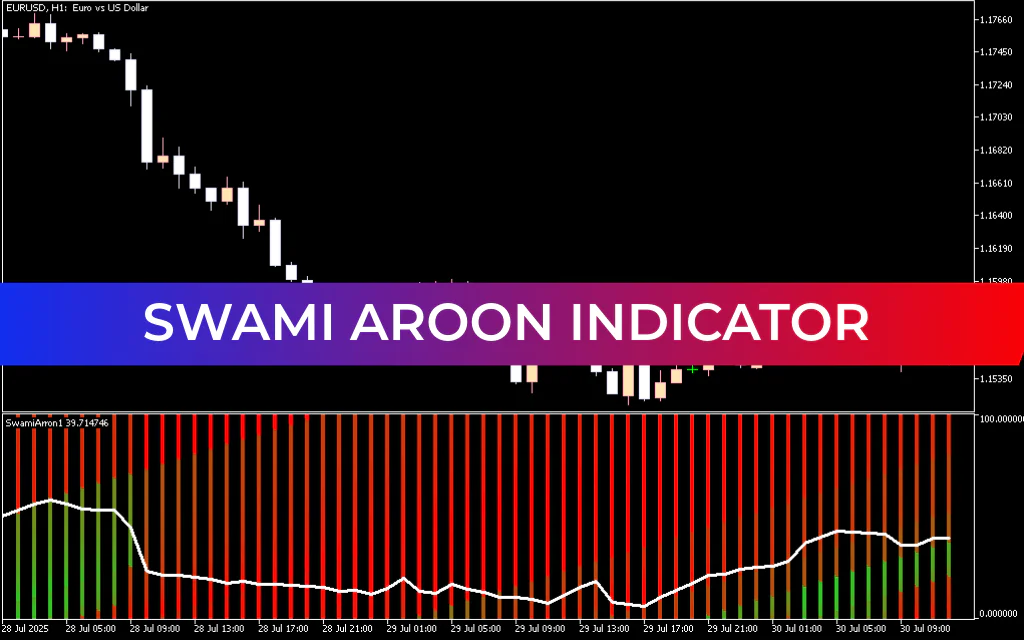
The Swami Aroon Indicator for MetaTrader 5 is a visually intuitive oscillator that helps traders identify overbought and oversold market conditions. Like other oscillators, it fluctuates between 0 and 100, signaling potential entry and exit points based on market momentum.
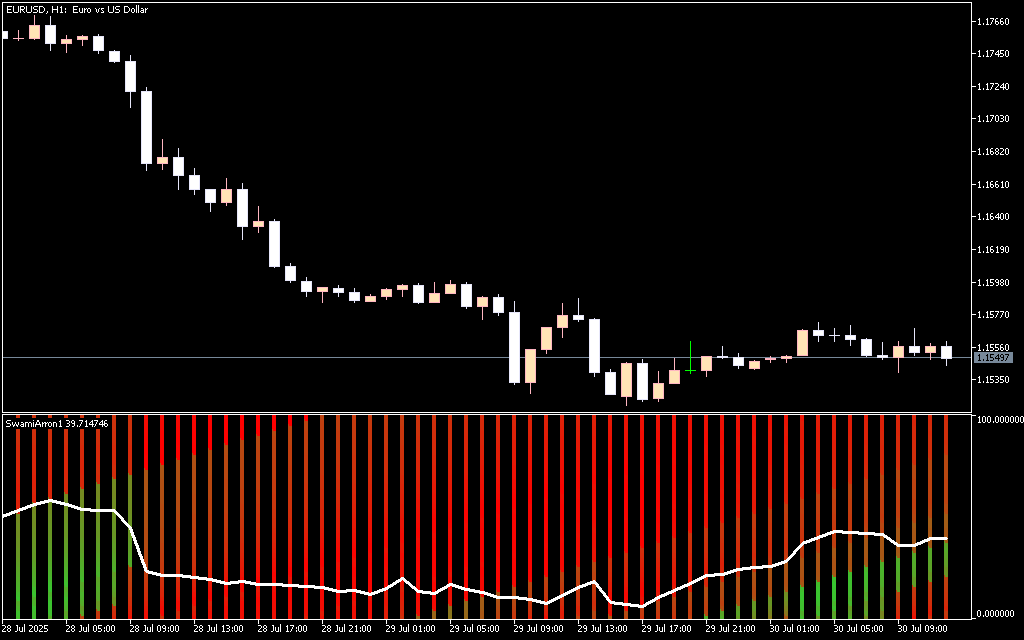
By combining traditional overbought/oversold readings with color-coded trend bars, this indicator provides clear and immediate insights into market direction.
How the Swami Aroon Indicator Works
- Overbought – Values above 80 indicate a market that may be topping; selling opportunities arise.
- Oversold – Values below 20 suggest a market that may be bottoming; buying opportunities appear.
The indicator also includes dynamic bars that reflect the recent price trend:
- Green Bars → Bullish momentum
- Bright Red Bars → Bearish momentum
The color gradually shifts as the oscillator moves: rising values transition toward green, signaling upward pressure, while falling values turn bright red, signaling downward momentum.
Trading Signals
Buy Position:
- Look for bright red bars indicating a downtrend.
- Enter when the oscillator moves below 20 (oversold).
- Exit when it reaches the overbought region above 80.
Sell Position:
- Look for green bars indicating an uptrend.
- Enter when the oscillator moves above 80 (overbought).
- Exit when it drops below 20 (oversold).
These simple visual cues help traders quickly identify trend direction and optimal entry/exit points.
Key Features
- Overbought & Oversold Detection – Oscillator ranges between 0–100.
- Color-Coded Trend Bars – Green for bullish, bright red for bearish.
- Clear Visual Signals – Highlights potential buy/sell zones at a glance.
- Easy-to-Use MT5 Integration – Clean display without chart clutter.
- Momentum Tracking – Color changes help follow Trend Strength.
Conclusion
The Swami Aroon Indicator for MT5 is a straightforward yet effective tool for spotting market extremes and trend shifts. With overbought/oversold signals and color-coded bars, traders can quickly determine entry and exit points while tracking the current trend with visual clarity. Perfect for those seeking a simple oscillator that combines trend detection with actionable signals.
FAQ
2 Downloads
Published:
Mar 04, 2026 09:52 AM
Category: