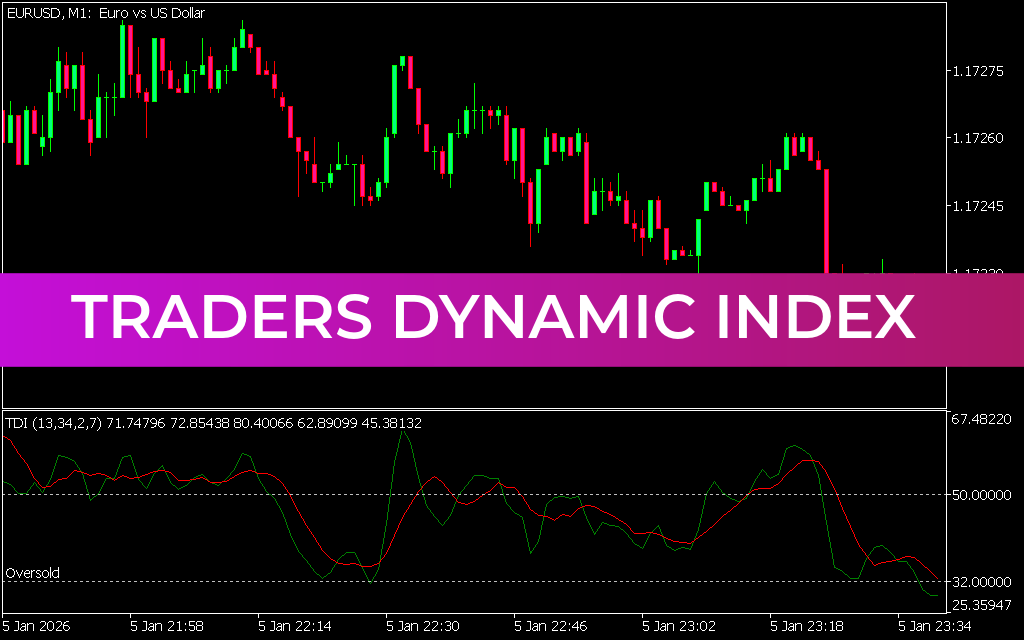
The Traders Dynamic Index (TDI) Indicator for MT5 is a powerful hybrid trading tool that combines the Relative Strength Index (RSI), moving averages, and Bollinger Bands to provide clear trend direction, market strength, and high-probability BUY and SELL signals.
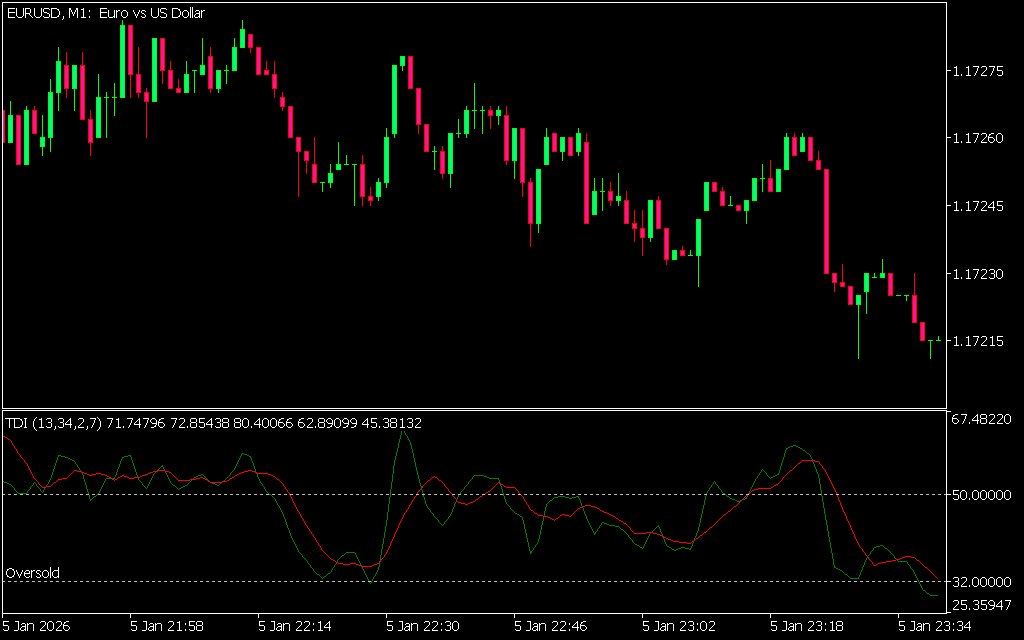
Displayed in a separate window below the chart, TDI helps traders understand momentum, volatility, and potential reversal zones in real time.
What Is the Traders Dynamic Index (TDI)?
The TDI is an advanced version of the RSI that enhances traditional momentum analysis by adding smoothing and volatility components.
It consists of:
- A Green line (Fast RSI line)
- A Red line (Signal line)
- Optional Bollinger Bands (volatility bands)
- A Midline (market baseline)
These components work together to measure:
- Trend Strength
- Market volatility
- Overbought and oversold conditions
Key Features of TDI Indicator for MT5
- Combines RSI, moving averages, and Bollinger Bands
- Displays fast and signal lines for crossover signals
- Identifies overbought (above 68) and oversold (below 32) zones
- Helps detect trend direction and reversals
- Works on all forex pairs and timeframes
- Suitable for Scalping, intraday, and swing trading
How the TDI Indicator Works
The indicator analyzes RSI-based momentum and smooths it using moving averages:
- Green line (fast line): reacts quickly to price changes
- Red line (signal line): slower, confirms trend direction
- Bollinger Bands: measure volatility and market expansion
Key levels:
- Above 68 → overbought condition
- Below 32 → oversold condition
BUY and SELL Signals
Buy Signal
A BUY setup occurs when:
- Green line crosses above the red line
- Market is moving out of oversold or neutral zone
- Momentum starts increasing upward
Entry: Enter buy after crossover confirmation
Stop Loss: Below recent swing low
Exit: At resistance or when lines cross downward
Sell Signal
A SELL setup occurs when:
- Green line crosses below the red line
- Market is in overbought or weakening phase
- Bearish momentum increases
Entry: Enter sell after confirmation
Stop Loss: Above recent swing high
Exit: At support or when bullish crossover occurs
How to Use TDI Effectively
To improve accuracy:
- Trade in direction of the main trend
- Use overbought/oversold zones for reversal confirmation
- Combine with Price Action signals (engulfing, pin bars)
- Avoid sideways markets without confirmation
- Use higher timeframe trend filtering
Take Profit Strategy
- For BUY trades: exit at resistance or when green line crosses below red line
- For SELL trades: exit at support or when green line crosses above red line
- Alternatively, use dynamic trailing stop methods
Best Timeframes
The TDI Indicator performs best on:
- M30 and H1 for intraday trading
- H4 for swing trading
- Daily charts for long-term trend analysis
Recommended Indicator Combinations
For stronger trading accuracy, combine TDI with:
- Moving Averages (trend direction)
- Support & Resistance levels
- MACD (momentum confirmation)
- Price action patterns
Advantages of TDI Indicator
- Provides clear trend and momentum signals
- Combines multiple technical tools in one system
- Easy crossover-based trading logic
- Works in trending and reversal markets
- Suitable for all trader experience levels
Limitations
- Can generate false signals in sideways markets
- Requires confirmation for best results
- Works better when aligned with trend direction
- Not ideal as a standalone system
Conclusion
The Traders Dynamic Index (TDI) Indicator for MT5 is a comprehensive momentum and trend analysis tool that helps traders identify strong BUY and SELL opportunities using RSI-based signals combined with volatility and smoothing filters.
When used with proper risk management and additional confirmation tools, it can significantly improve trading accuracy and decision-making.
Published:
Apr 13, 2026 09:04 AM
Category: