The Total Power Indicator for MetaTrader is a versatile trading tool designed to measure the strength of bulls and bears in the market. By combining a 13-day EMA with technical analysis of price movements, the indicator provides clear insights into trend direction, Trend Strength, and potential reversals. It is suitable for novice, intermediate, and advanced traders, as well as for Scalping, intraday, and swing trading.
How the Total Power Indicator Works
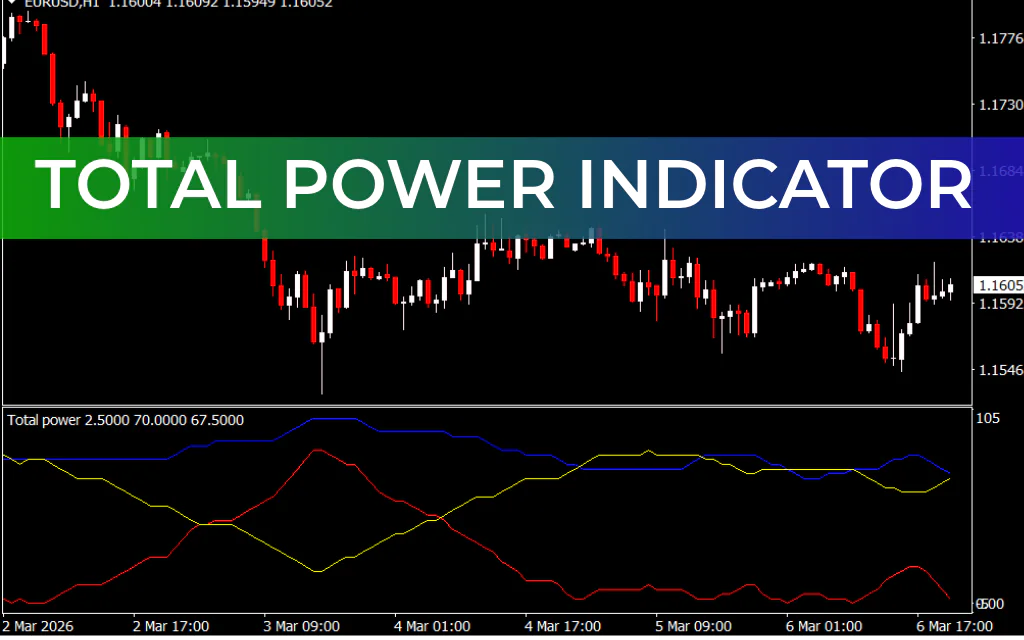
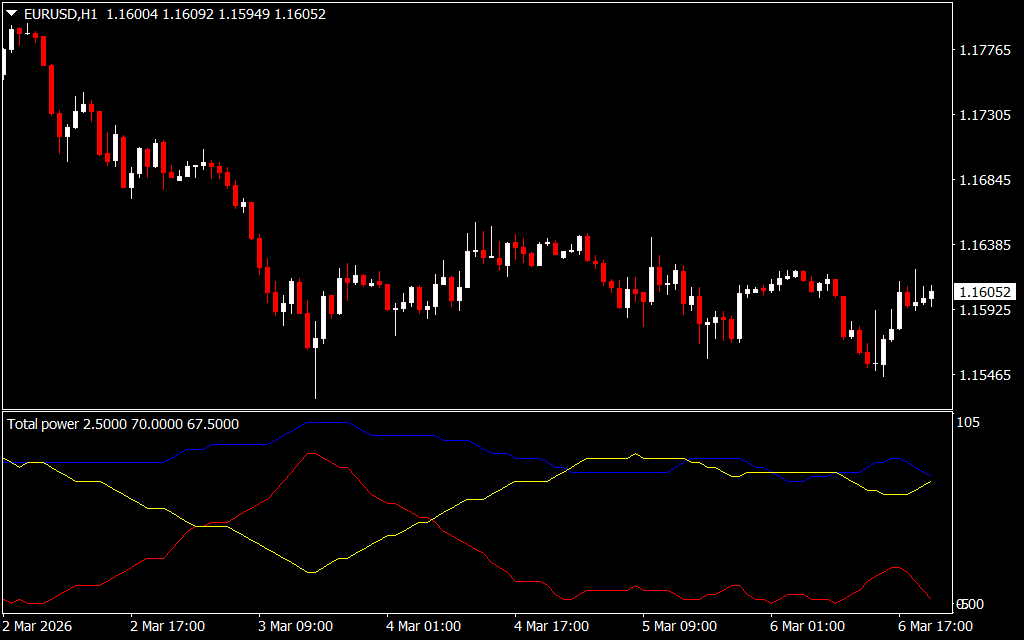
The indicator uses three lines to display market power:
- Yellow Line – Represents bull power
- Red Line – Represents bear power
- Blue Line – Shows the total strength of the trend
Trading Signals
Bullish Signal
- Yellow line (bulls) crosses above the red line (bears) from below
- Indicates potential upward movement
- Confirm with Price Action patterns like bullish engulfing candlestick
Bearish Signal
- Red line (bears) crosses above the yellow line (bulls) from above
- Indicates potential downward movement
- Confirm with bearish price action
Trend Confirmation
- Intersection of the yellow and red lines above the 50-level signals a strong bullish or bearish trend
By combining the line crossings with candlestick confirmations, traders can generate high-probability trade entries and exits.
Why Traders Use the Total Power Indicator
- Measures market dominance between bulls and bears
- Highlights trend reversals and continuation
- Provides clear buy and sell signals
- Works on multiple timeframes, suitable for MTF analysis
- Enhances decision-making for scalping, intraday, and swing trades
The indicator allows traders to quickly assess market strength and adjust their positions accordingly.
Conclusion
The Total Power Indicator for MT4 is a powerful tool for trend analysis and reversal signals. With its bull/bear power lines, total trend strength, and signal confirmations, it helps traders make informed trading decisions.
The indicator is free to download and fully compatible with MetaTrader 4.
FAQ
2 Downloads
Published:
Mar 08, 2026 08:59 AM
Category: