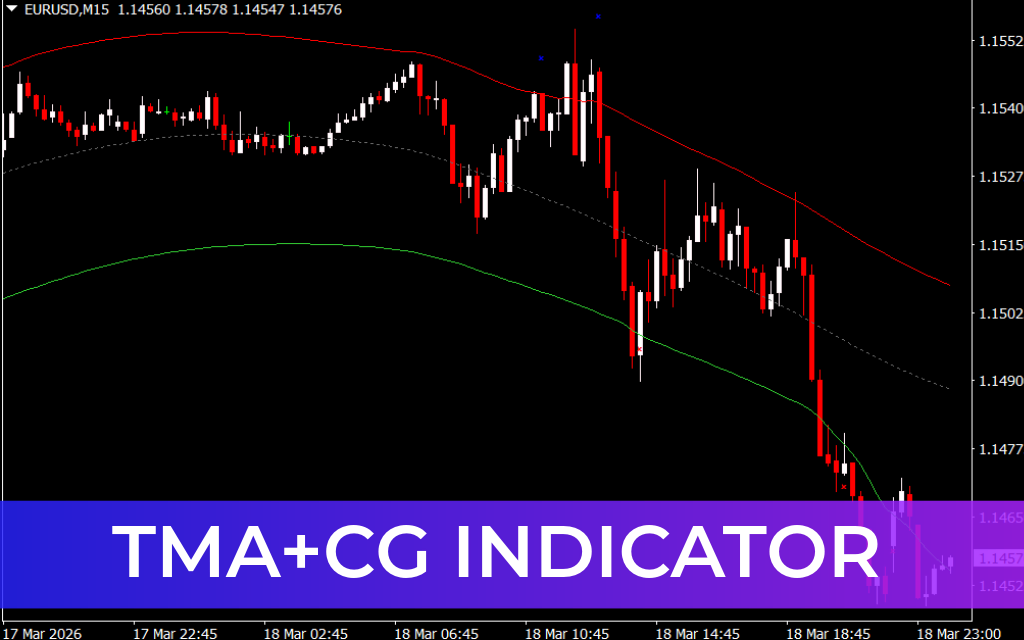
The TMA+CG Indicator for MT4 is a powerful channel trading tool designed to help traders track price movements, identify Support And Resistance levels, and make informed trading decisions. Combining the Triangular Moving Average (TMA) with the Center of Gravity (CG), this indicator provides accurate channels and visual signals that save time and simplify trading.
Suitable for traders of any experience level, the TMA+CG Indicator works well for swing trading, day trading, and Scalping. It can be applied to any forex pair or financial instrument and across all timeframes.
How the TMA+CG Indicator Works
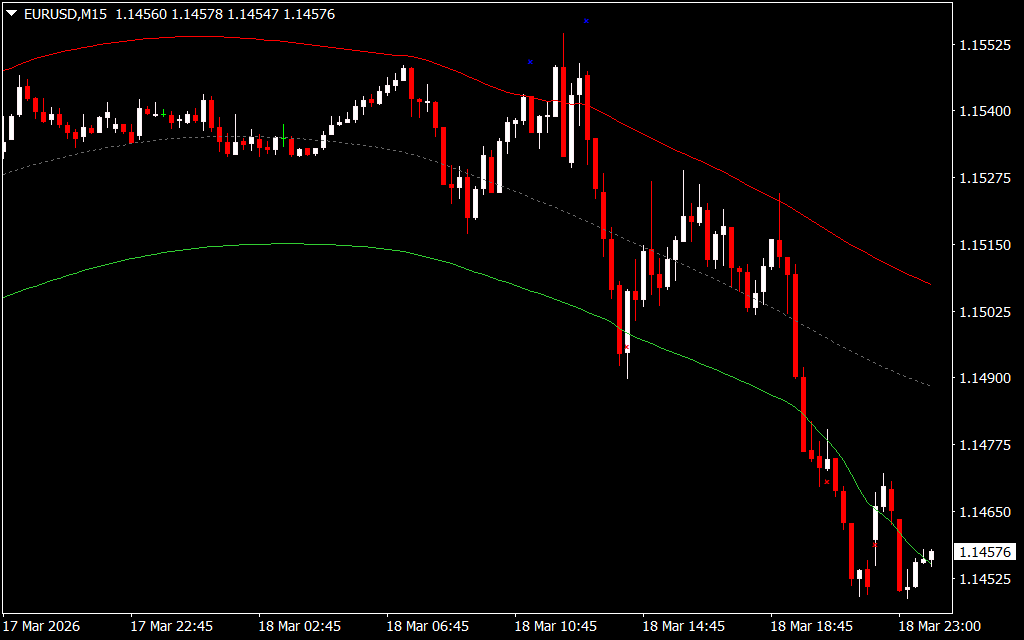
The indicator plots a dynamic price channel consisting of:
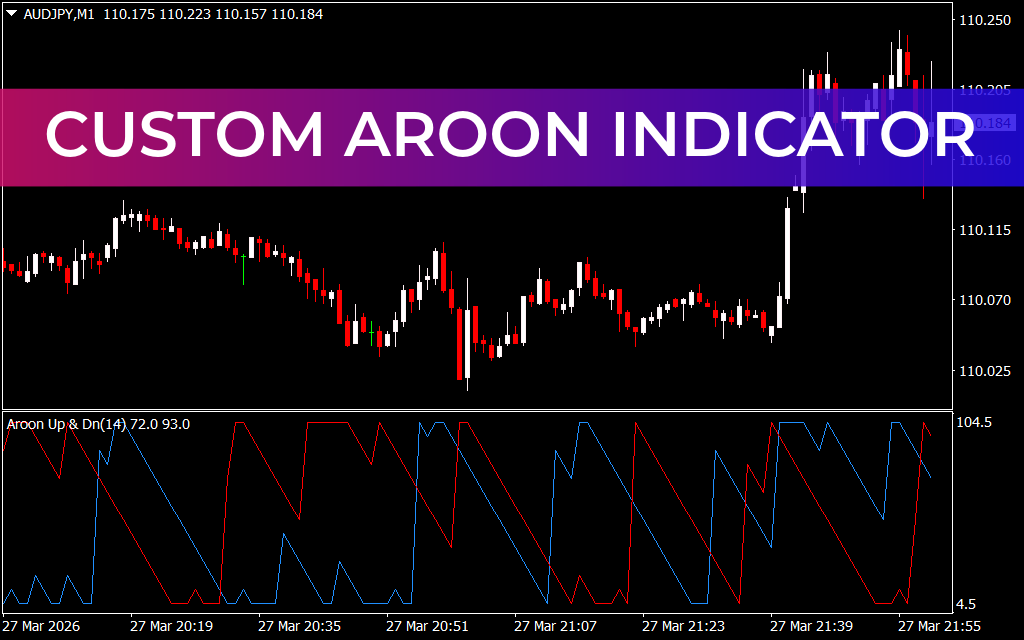
- Upper Band (Red Line): Acts as a dynamic resistance and overbought zone.
- Lower Band (Green Line): Acts as dynamic support and oversold zone.
The indicator generates cross signals when the price interacts with the channel:
- Blue Cross: Appears when the price breaks above the upper channel → signals a potential sell.
- Red Cross: Appears when the price touches the lower channel → signals a potential buy.
These crosses serve as entry points and can also be used for stop-loss placement.
Buy and Sell Setup
Buy Trade
- Wait for the price to touch the lower channel (green line).
- Observe a red cross signaling an impending upward trend.
- Enter a long position with a stop-loss below the swing low.
- Exit when the price reaches the upper channel or a blue cross forms.
Sell Trade
- Wait for the price to touch the upper channel (red line).
- Observe a blue cross signaling a potential downward trend.
- Enter a short position with a stop-loss above the swing high.
- Exit when the price reaches the lower channel or a red cross forms.
Practical Example
On a GBP/USD chart:
- The indicator’s green lower band represents dynamic support. A price break below this line generates a red cross, signaling a buy opportunity.
- The red upper band represents dynamic resistance. When the price touches this line, a blue cross appears, signaling a sell opportunity.
- In the example, the buy signal captured over 60 pips, while the sell signal captured over 100 pips.
Benefits of the TMA+CG Indicator
- Visualizes dynamic support and resistance levels for more precise trading.
- Works across all timeframes and instruments, including forex and commodities.
- Ideal for swing trading, scalping, and intraday strategies.
- Cross signals simplify entry, exit, and stop-loss placement.
- Can be combined with other indicators to enhance trading accuracy.
Conclusion
The TMA+CG Indicator for MT4 is an essential tool for traders using channel-based strategies. Its dynamic upper and lower bands clearly define support and resistance zones, while the red and blue cross signals indicate potential trend changes. To maximize performance, combine the TMA+CG indicator with other technical tools and trend analysis strategies.
FAQ
2 Downloads
Published:
Mar 18, 2026 19:03 PM
Category: