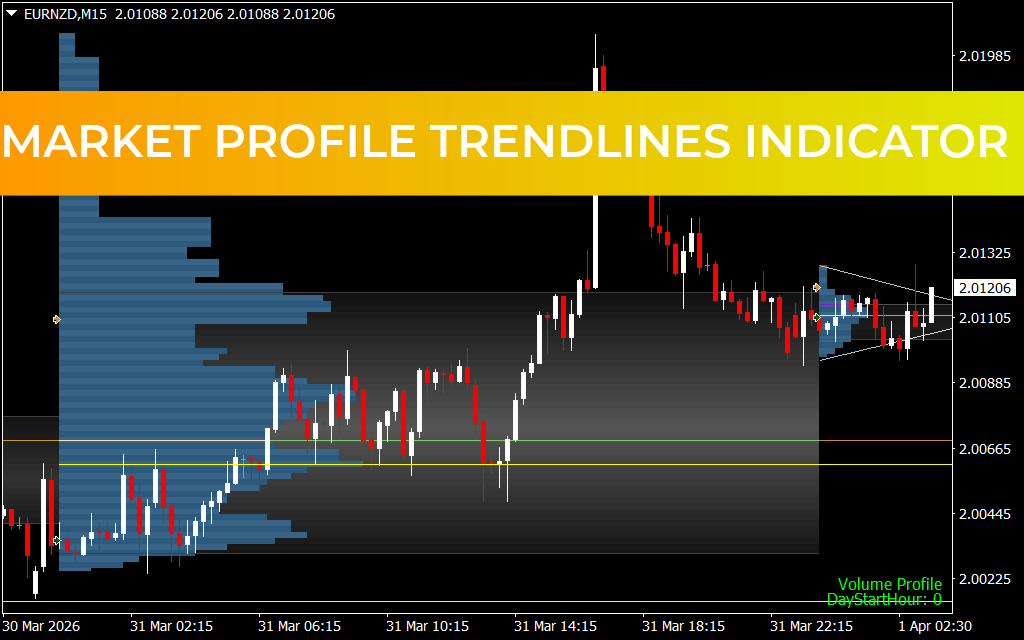
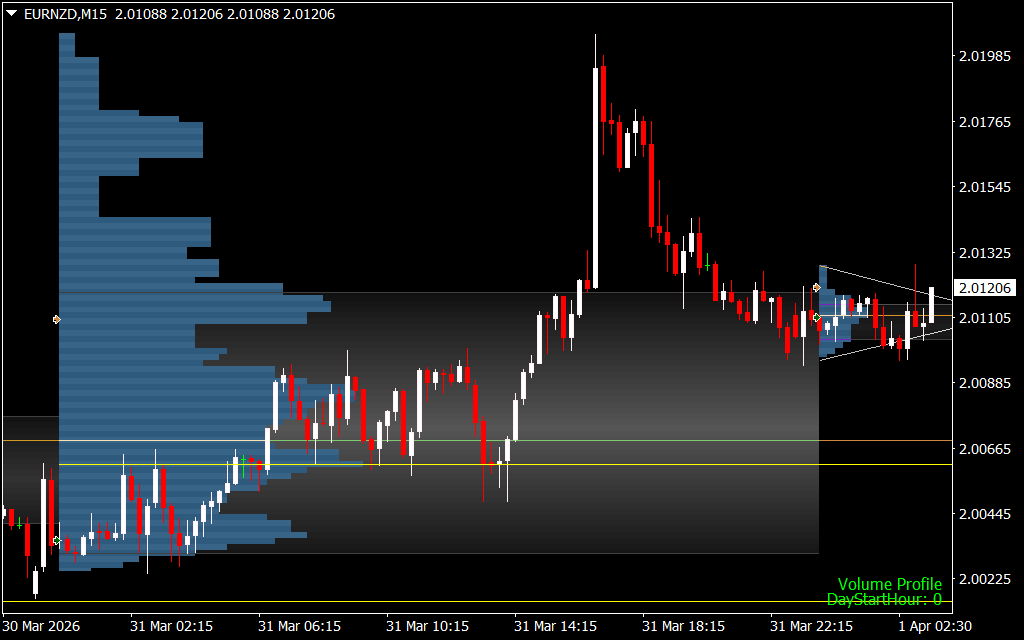
The Market Profile Trendlines (MP Trendlines) Indicator is a sophisticated MT4 tool that visualizes price density over time, highlighting the most important price levels, value areas, and control values for any trading session.
By combining volume, time, and tick data, this indicator gives traders an accurate view of where the market’s activity is concentrated, helping identify key support/resistance zones and potential reversals.
What is the Market Profile Trendlines Indicator?
The Market Profile concept was developed by traders at the Chicago Board of Trade (CBOT) to present price and time data in an easy-to-understand format.
The MP Trendlines indicator extends the traditional Market Profile by adding trend lines and using high-precision tick data to generate a histogram of trading activity:
- Histogram: Displays areas with high price activity across a session.
- Right-to-Left Layout: Unlike traditional left-to-right charts, this format emphasizes the current trading session without clutter.
- Timeframes: Works from M1 to D1, showing profiles for each session.
- Focus: Fully based on Price Action, independent of other MT4 indicators.
Key Features of the Indicator
- Value Area: Represents the midpoint of Supply And Demand, showing where 70% of the trading activity occurs.
- Top and Bottom Tails: Highlight rejected price areas:
- Bottom Tail: Indicates buyers dominating sellers.
- Top Tail: Indicates sellers outperforming buyers.
- Trendlines: Shows the general trend of price activity for the session.
How to Trade with the MP Trendlines Indicator
The value area and tails form the basis for trading setups.
Buy Setup:
- Identify the bottom tail on the chart.
- Wait for bullish price action confirmation (e.g., bullish engulfing candle).
- Place a stop-loss near the recent low.
- Exit the trade when the trend reverses.
Sell Setup:
- Identify the top tail on the chart.
- Wait for bearish price action confirmation.
- Place a stop-loss near the recent high.
- Exit the trade when the trend reverses.
Trading Tips
- Combine the MP Trendlines indicator with technical tools like Simple Moving Averages (SMA) to confirm trend direction.
- Focus on the value area for intraday trading opportunities.
- Monitor the tails as key zones for potential reversals.
Conclusion
The Market Profile Trendlines Indicator is a powerful tool for visualizing every price move during a session. It highlights critical zones where price is likely to react, helping traders make informed buy and sell decisions.
By combining it with other indicators like moving averages or price action strategies, traders can gain a clearer picture of market trends and improve the timing of their entries and exits.
5 Downloads
Published:
Mar 31, 2026 21:43 PM
Category: