Interestingly, the MT4 trading platform does not include a built-in indicator that automatically plots Support And Resistance levels—despite these levels being among the most important tools in technical analysis. The Auto Support & Resistance Indicator fills this gap by automatically identifying and displaying key price levels on the chart.
Indicator Overview
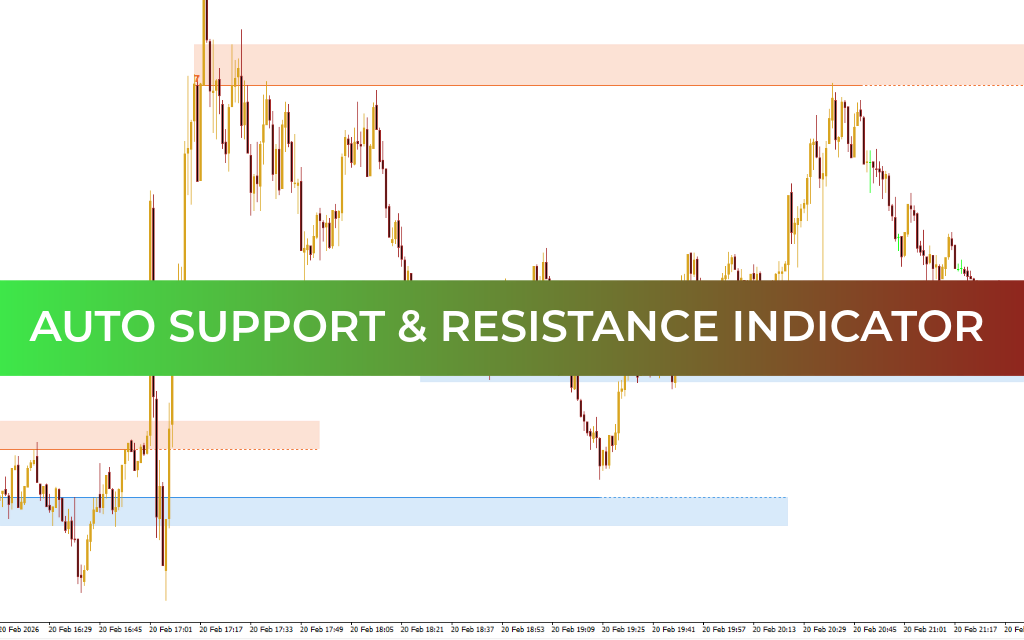
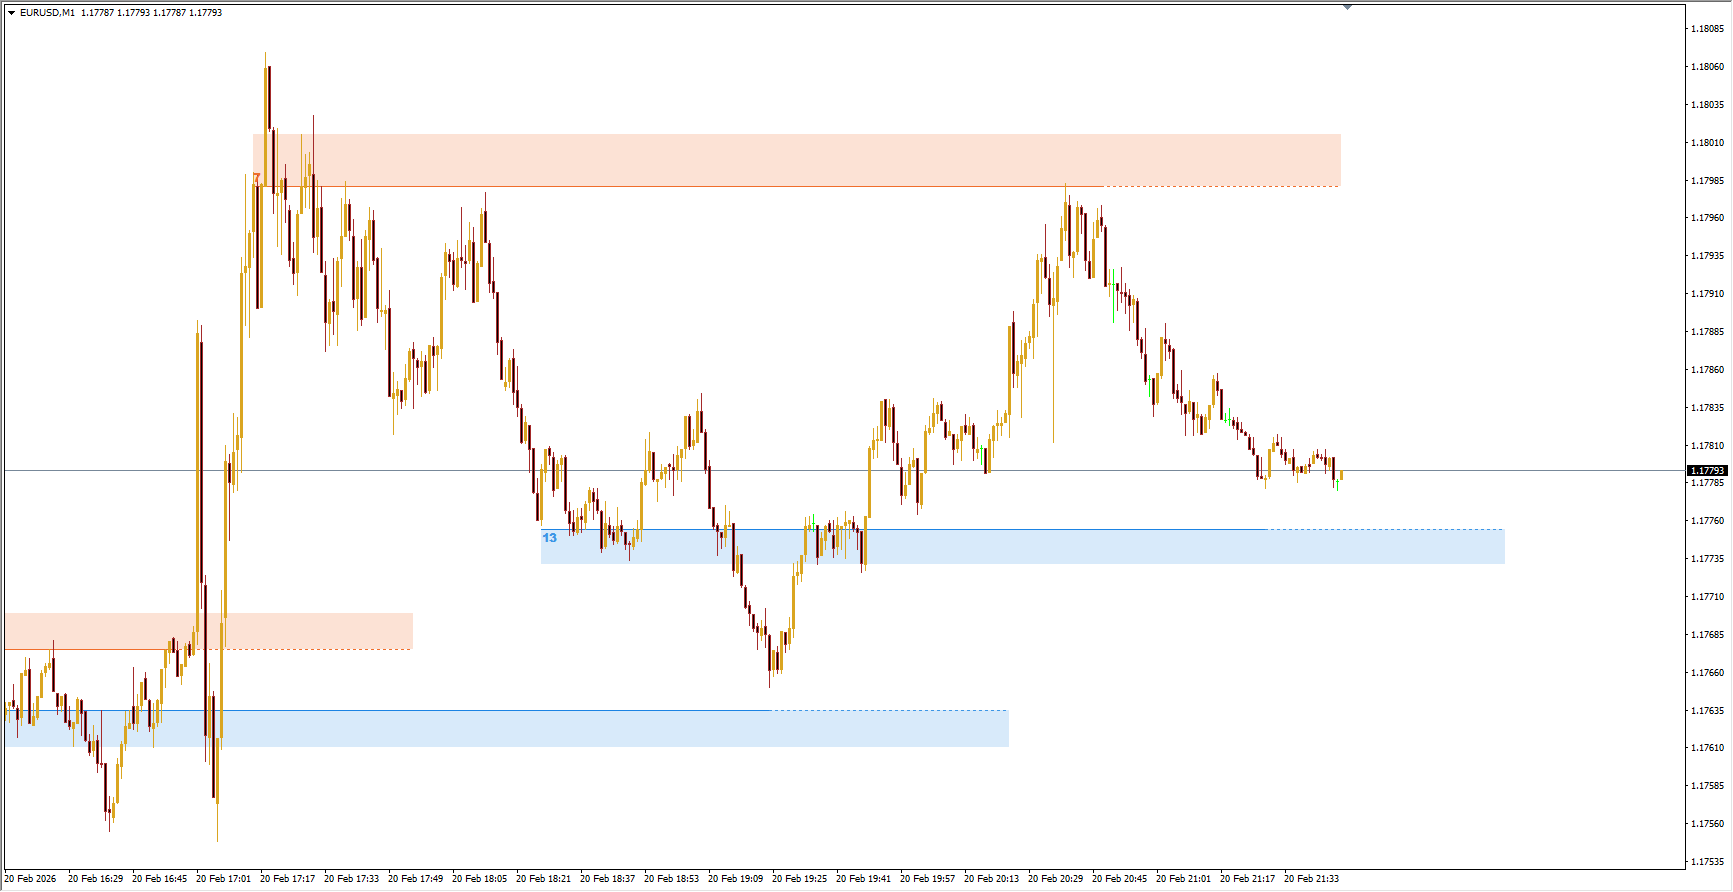
The Auto Support & Resistance indicator automatically marks important price zones where buying or selling pressure is likely to occur.
Resistance zones are displayed in red, indicating areas where sellers may become active as price approaches.
Support zones are displayed in blue, highlighting areas where buyers may show interest.
By automatically drawing relevant levels, the indicator saves time and simplifies chart analysis. This makes it especially useful for both experienced traders and beginners.
However, new traders are encouraged to practice drawing levels manually to better understand Market Structure and price behavior. In this case, the automatically plotted levels can serve as helpful guidance or confirmation.
Support and resistance zones can also assist in:
Identifying potential entry points
Placing stop-loss and take-profit orders
Confirming trading signals
How the Indicator Draws Levels
Support and resistance zones are typically based on market turning points, known as fractals. While the standard MT4 platform includes a Fractals indicator, the Auto Support & Resistance indicator already integrates this functionality.
It analyzes clusters of fractals and draws zones where they occur most frequently. For example, a resistance level may be formed from multiple fractal points (such as 11). Traders can check which fractals contributed to a level by clicking the number shown at the start of the zone.
The height of each zone depends on how far apart the fractals are:
Wider spacing between fractals creates a taller zone.
Closer fractals produce a narrower zone.
Instead of redrawing levels completely, the indicator adjusts their height as new fractals appear.
How to Trade Using the Indicator
Trading with support and resistance zones typically involves two main strategies:
Rebounds from levels
Breakouts through levels
The effectiveness of these approaches depends on market conditions.
Range (Flat) Market
Trading between support and resistance in a sideways market is one of the simplest and often most profitable strategies. Traders buy near support and sell near resistance.
However, flat markets are temporary and usually lead to a trend. Breakouts often occur in the direction of the previous trend, making continuation more likely than reversal.
Trending Market
During strong trends, support and resistance zones act as dynamic reaction points. Traders often enter positions in the direction of the main trend when price interacts with these zones.
Combining support/resistance zones with trend lines can significantly improve trade accuracy. For example:
Resistance combined with a downtrend line strengthens sell signals.
Support aligned with an uptrend strengthens buy signals.
Conclusion
The Auto Support & Resistance indicator is a powerful tool for identifying key price zones quickly and efficiently. By combining automatic level detection with customizable settings, it becomes a valuable component of almost any trading strategy. When used alongside trend analysis and confirmation tools, it can greatly enhance market analysis and decision-making.
FAQ
4 Downloads
Published:
Feb 20, 2026 15:18 PM
Category: