The Weighted Average True Range (WATR) Indicator is a powerful and easy-to-use technical indicator for MetaTrader 4 (MT4). It is an improved version of the classic Average True Range (ATR) indicator that helps traders identify market trends and potential price reversals more effectively.
Unlike the traditional ATR, the WATR indicator applies a weighting factor to smooth price volatility. This enhancement allows the indicator to react faster to recent price movements, making it more responsive to changing market conditions.
The WATR indicator is beginner-friendly and works with all forex currency pairs and timeframes on MetaTrader 4. Its clear visual signals make it an excellent tool for both new and experienced traders.
How the WATR Indicator Works
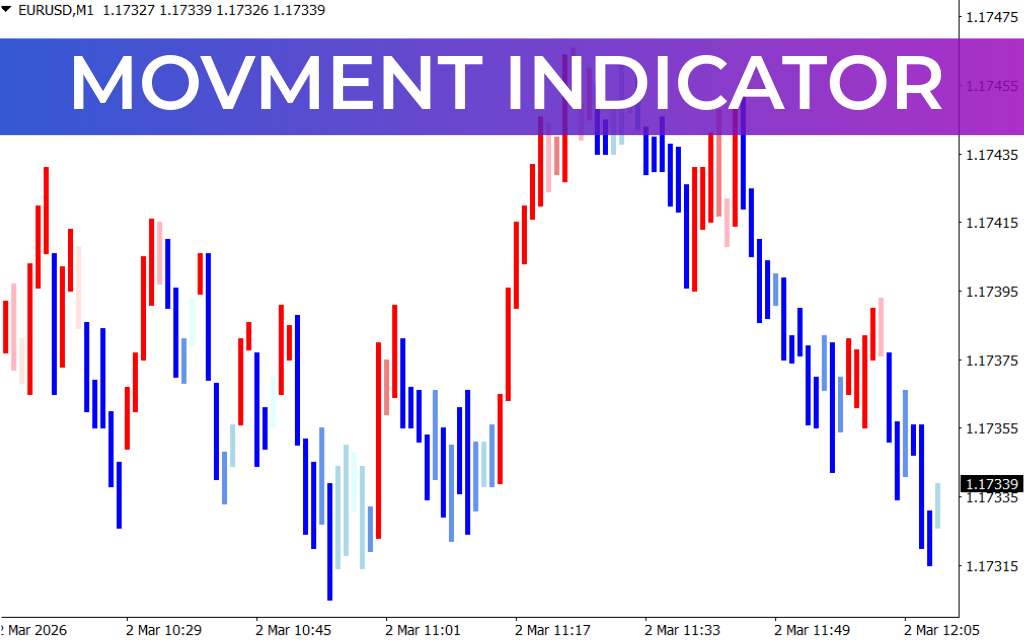
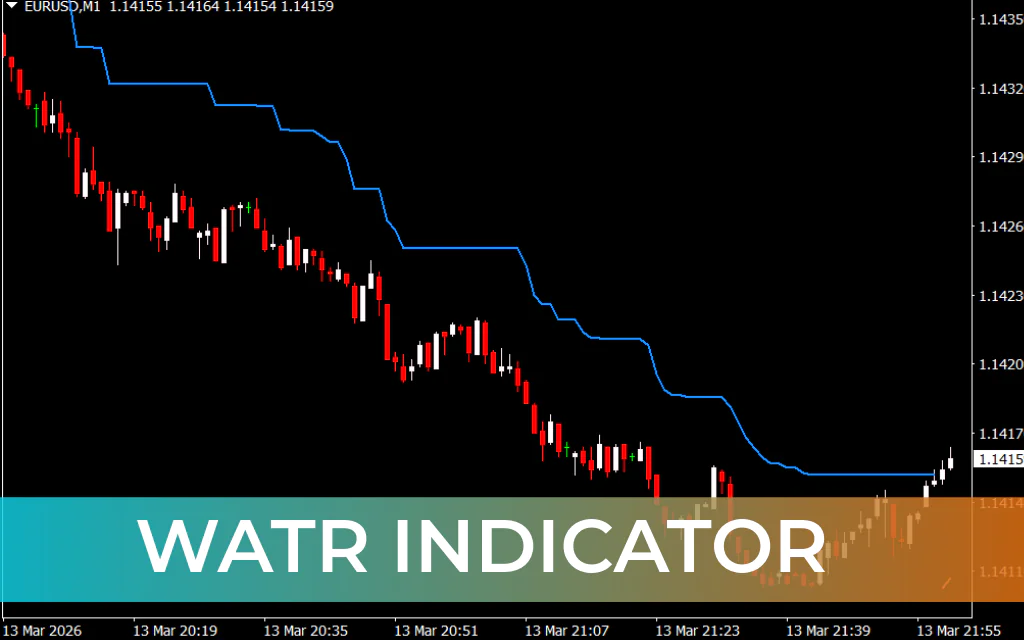
The indicator plots two colored lines directly on the chart to reflect market direction:
- Dodger Blue Line – Indicates a potential bearish trend
- Coral Line – Indicates a potential bullish trend
These lines follow price movements and help traders quickly identify trend changes and possible entry opportunities.
Buy Signal
A buy signal appears when the indicator switches from a blue line to a coral line, signaling a potential upward trend.
Steps to confirm a buy trade:
- Wait for the coral line to appear after a continuous blue line.
- Allow the candlestick where the coral line appears to fully close.
- Ensure the candle closes above the previous blue line.
- Enter a long position once the bullish confirmation occurs.
This signal suggests that bullish momentum may be starting.
Sell Signal
A sell signal occurs when the indicator changes from a coral line to a blue line, indicating possible bearish momentum.
Steps to confirm a sell trade:
- Watch for the blue line to appear after the coral line ends.
- Wait for the candlestick to close below the indicator line.
- Confirm the candle forms under the previous coral line.
- Enter a short position after confirmation.
This typically signals the beginning of a downtrend.
Exit Strategy
A simple exit strategy using the WATR indicator:
- Close a buy trade if a blue line appears above the candlesticks.
- Close a sell trade if a coral line appears below the candlesticks.
These changes usually indicate a Trend Reversal.
The indicator lines can also serve as an effective trailing stop-loss, helping traders protect profits while the trend continues.
For better results:
- Use a 3:1 risk-to-reward ratio.
- Combine the WATR indicator with Price Action analysis or other trend indicators.
- Adjust indicator parameters to match your trading strategy.
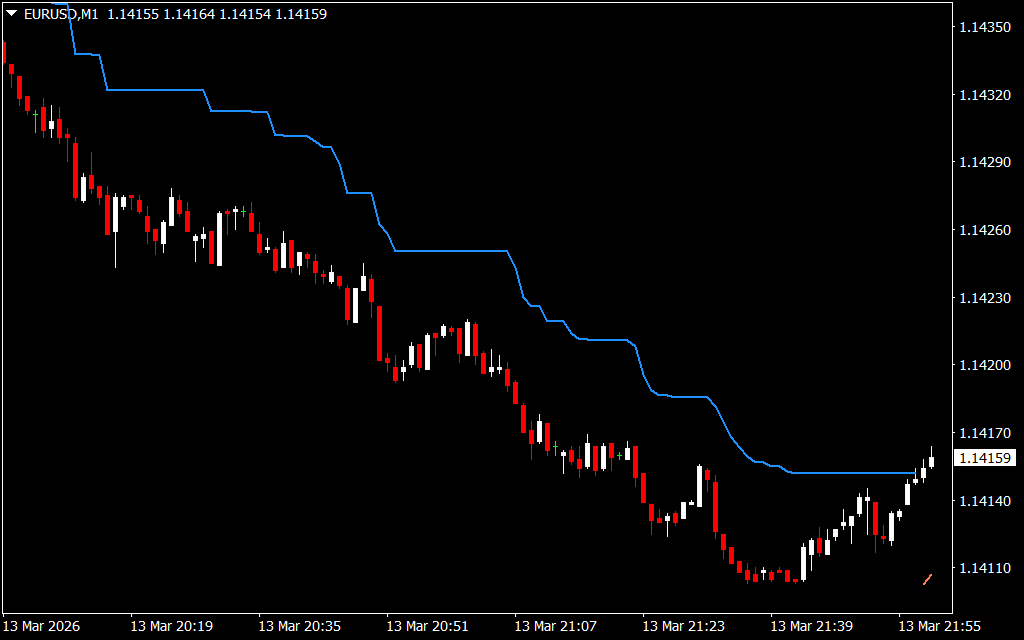
Chart Example
On a daily chart of the GBP/AUD currency pair, the WATR indicator demonstrates how trend changes appear visually:
- During a bullish trend, the indicator plots a coral line, with candlesticks closing above the line.
- When the trend reverses to bearish, the indicator switches to a dodger blue line.
- In a downtrend, candlesticks consistently close below the indicator line, confirming selling pressure.
This behavior makes the indicator particularly useful for identifying trend direction and stop-loss levels.
Conclusion
The Weighted Average True Range (WATR) Indicator is a simple yet effective trading tool that helps traders quickly identify trend direction, entry points, and potential reversals.
Because of its clear visual signals and minimal complexity, it is ideal for beginners while still offering value to experienced traders. The indicator works well as a standalone tool but can also be combined with other technical analysis methods to improve trading accuracy.
FAQ
1 Download
Published:
Mar 14, 2026 07:39 AM
Category: